
Gamma Exposure (GEX) levels, Call/Put Wall barriers, and 0DTE options metrics in this report represent hypothetical and analytical projections for educational purposes only.
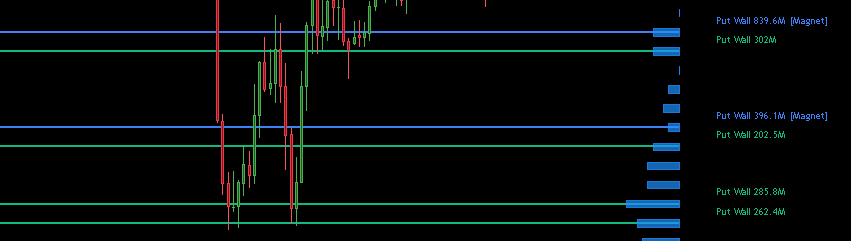
GEX WALL LEVELS (CALL / PUT)
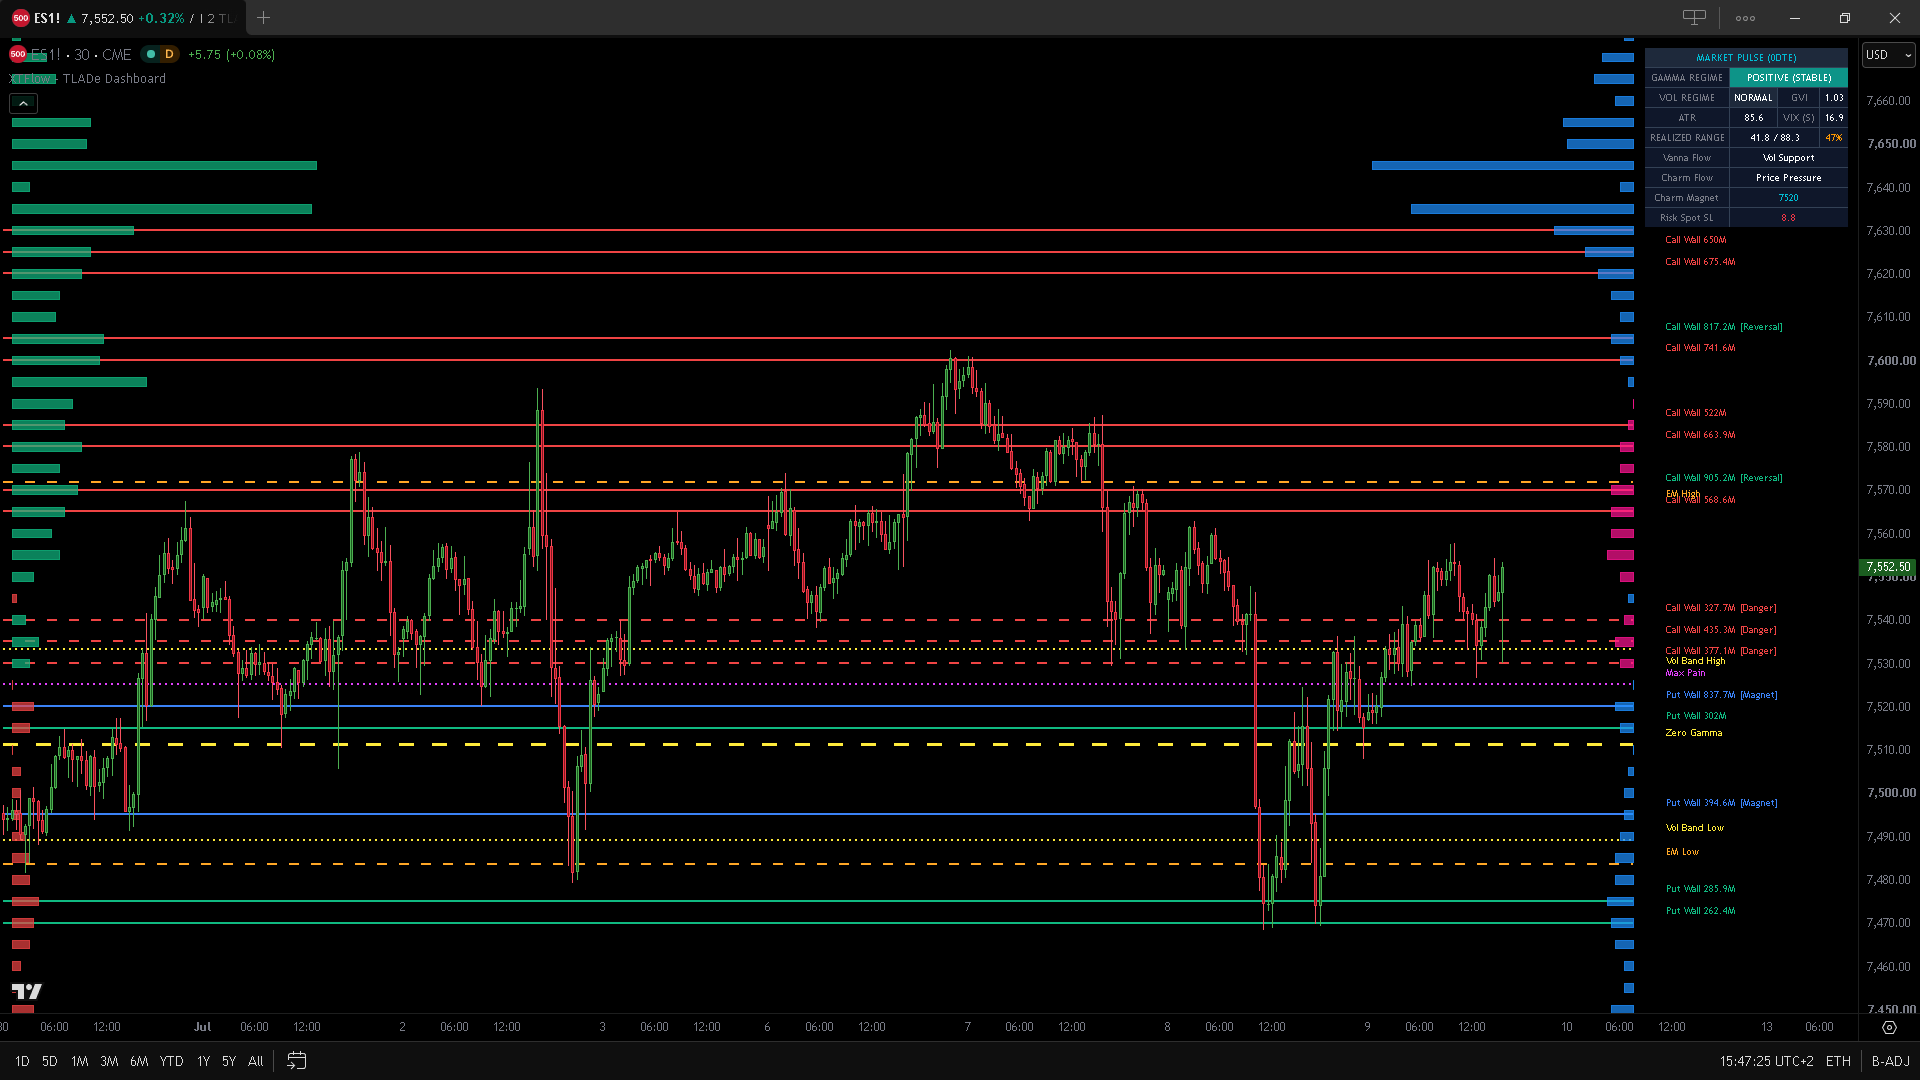
LINE STRUCTURAL STATES:
- Stale (Obsolete): Plotted with a dotted line style.
- Flipped: Inverted dealer exposure, dashed line style.
- Normal (Standard): Session standard solid line.
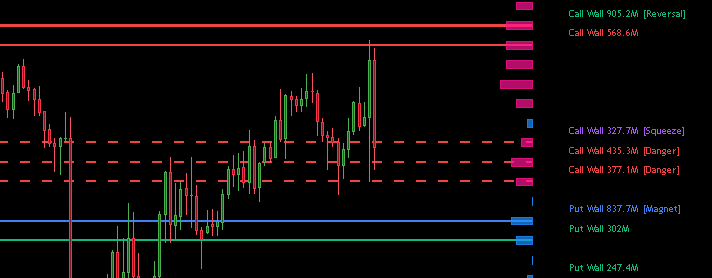
GREEK RISK CLASSIFICATION:
- Magnet: Attraction levels where volume concentration tends to pull and stabilize spot price.
- Squeeze: Signals forced dealer hedging areas.
- Danger: Highlights potential acceleration zones driven by forced dealer rebalancing.
- Reversal: Levels exhibiting a high theoretical holding probability, identifying potential bounce zones.
* Note: The color palette associated with each Greek risk sensitivity is fully customizable within the script configuration panel.
Allows graphical definition of primary levels (Top-N) by increasing line width. The script computes inter-level spacing via ATR to automatically shift labels, preserving chart clarity and readability.
SYSTEM LEVELS
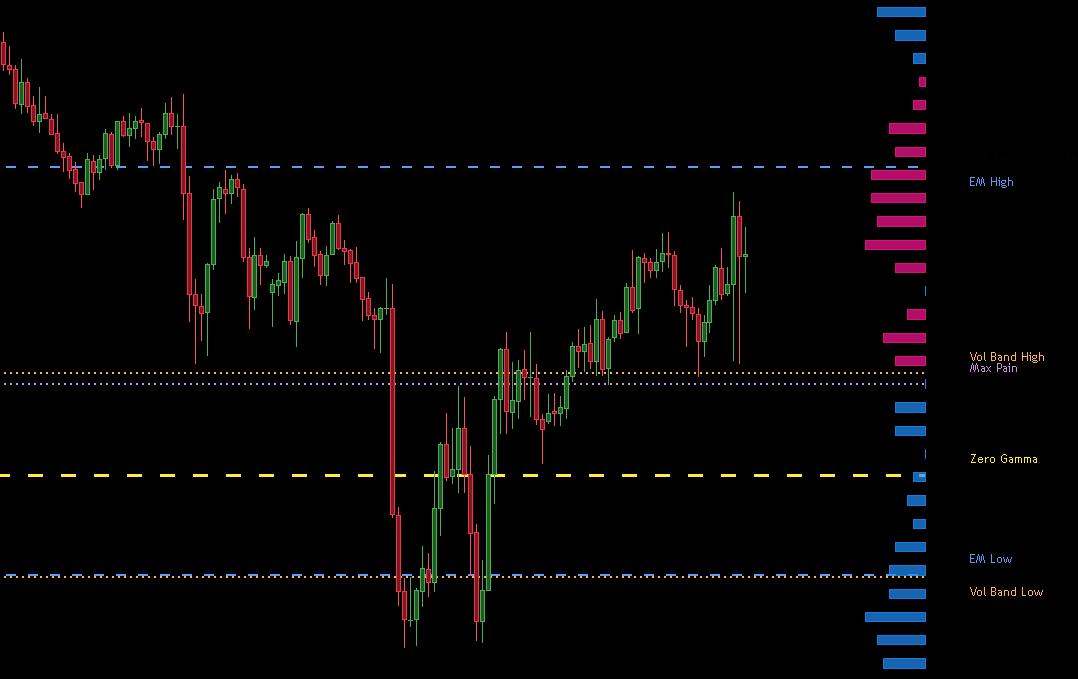
- Zero Gamma Level (ZG): The structural watershed of the volatility regime. Above this line, orderly price stability prevails; below it, fluctuations tend to expand significantly.
- Max Pain (MP): The theoretical strike price that minimizes the total aggregate value of options at expiration, historically exerting a gravitational pull on price.
- Expected Move (EM High / Low): The intraday expected range limits calculated implicitly from options pricing, valuable for detecting statistical trend exhaustion.
- Volatility Bands (High / Low): Extreme volatility boundaries signaling short-term overextension and potential mean-reversion zones.
ADVANCED DYNAMIC FILTERS
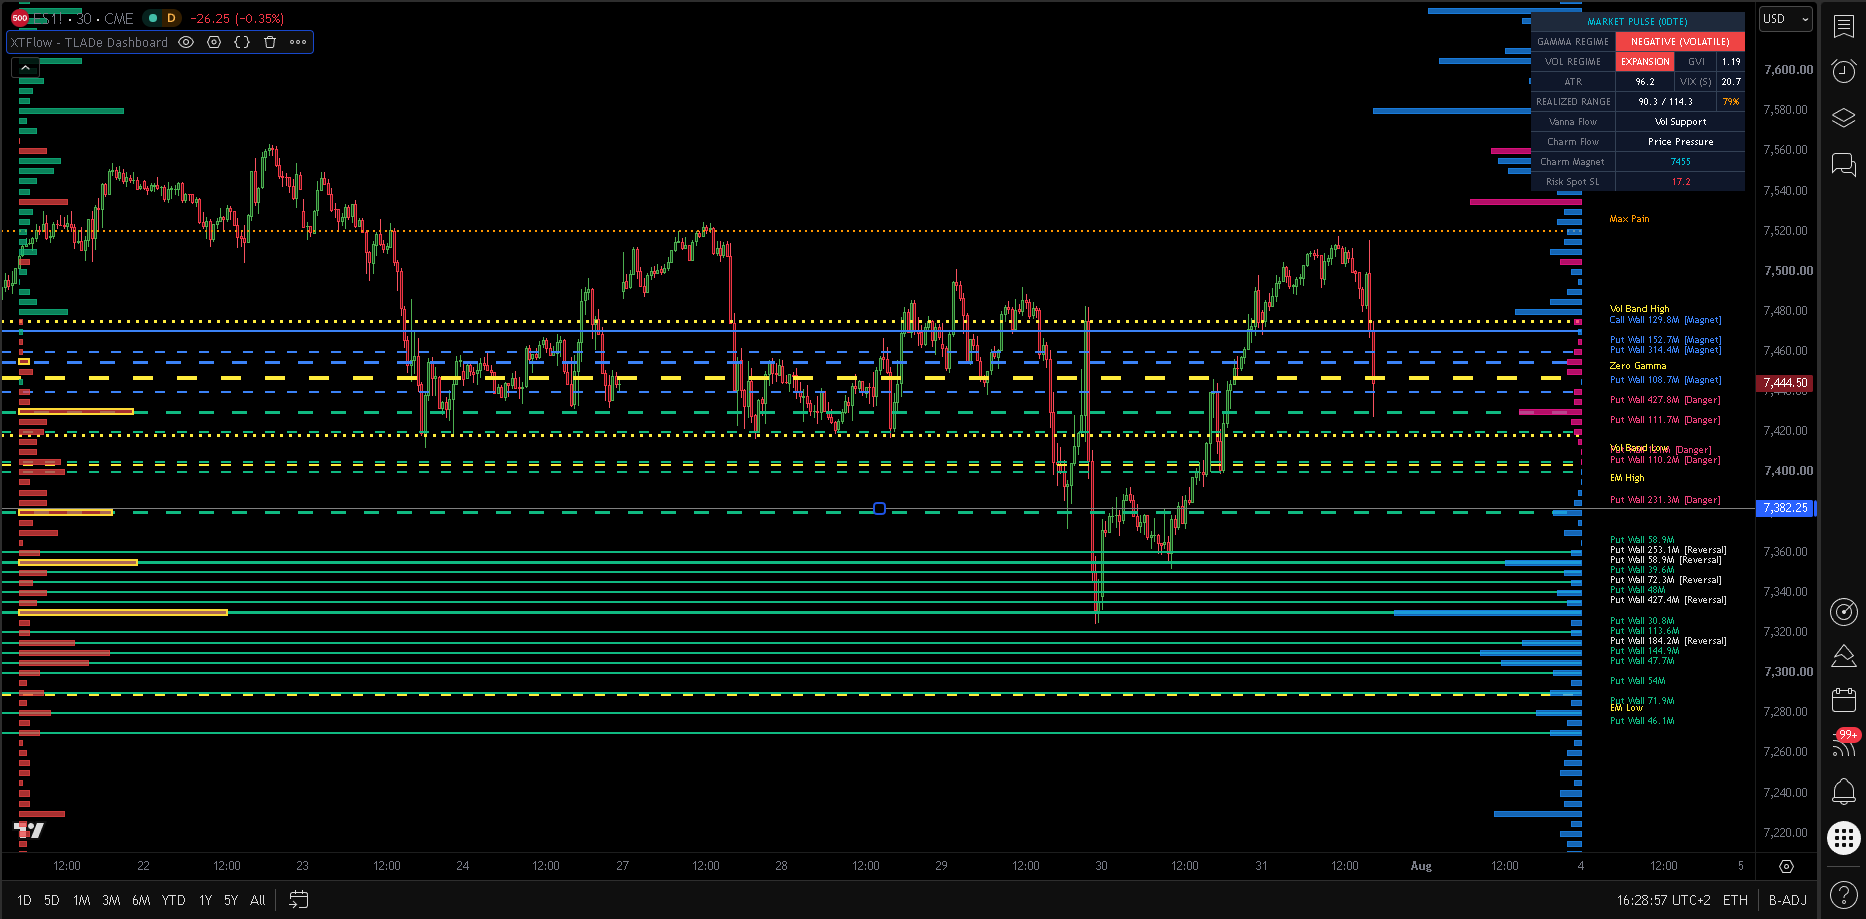
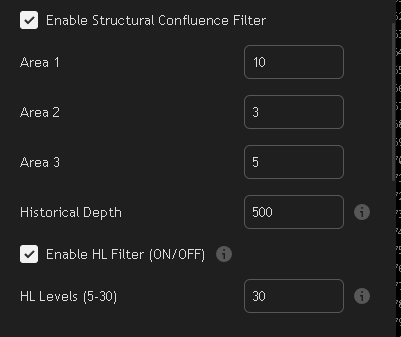
The noise reduction algorithm acts as a quantitative filter on the options chain, filtering minor fluctuations and emphasizing dominant volume concentrations. By cross-referencing GEX mass with value areas and operational proximity to spot price, the indicator converts high data density into a synthetic, highly streamlined map focused exclusively on high-probability reaction zones.
HORIZONTAL GEX PROFILE & CONVEXITY
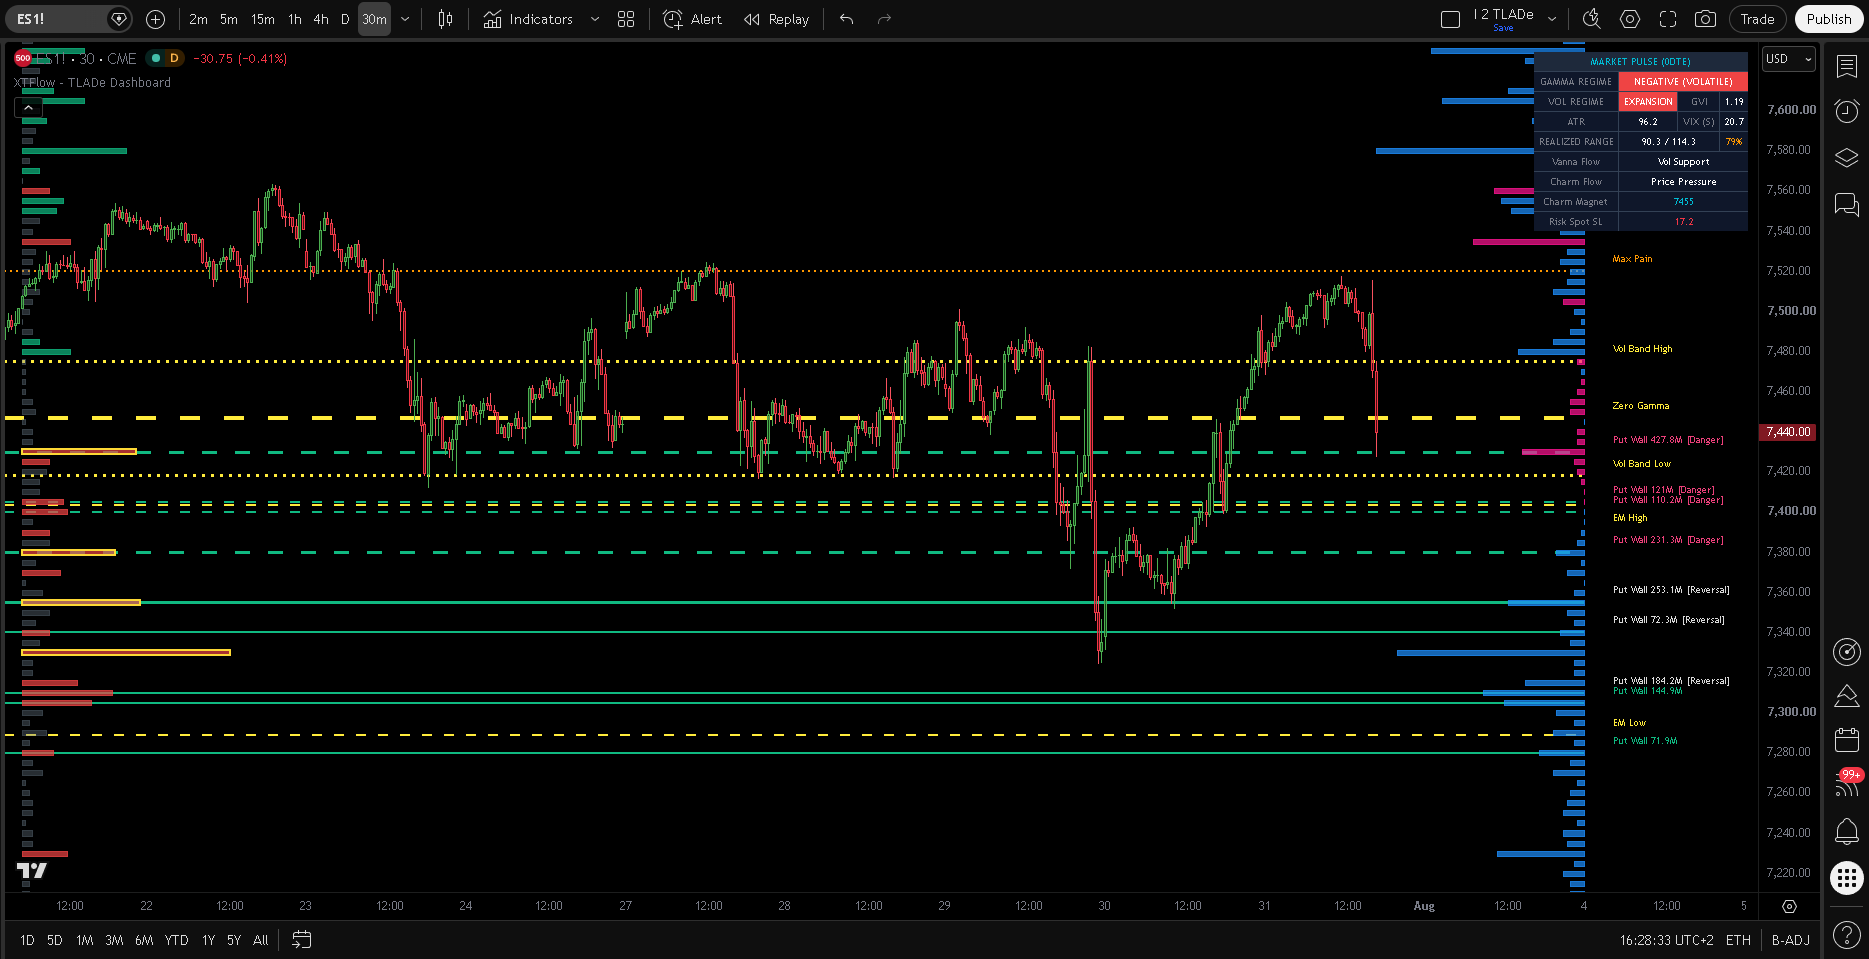
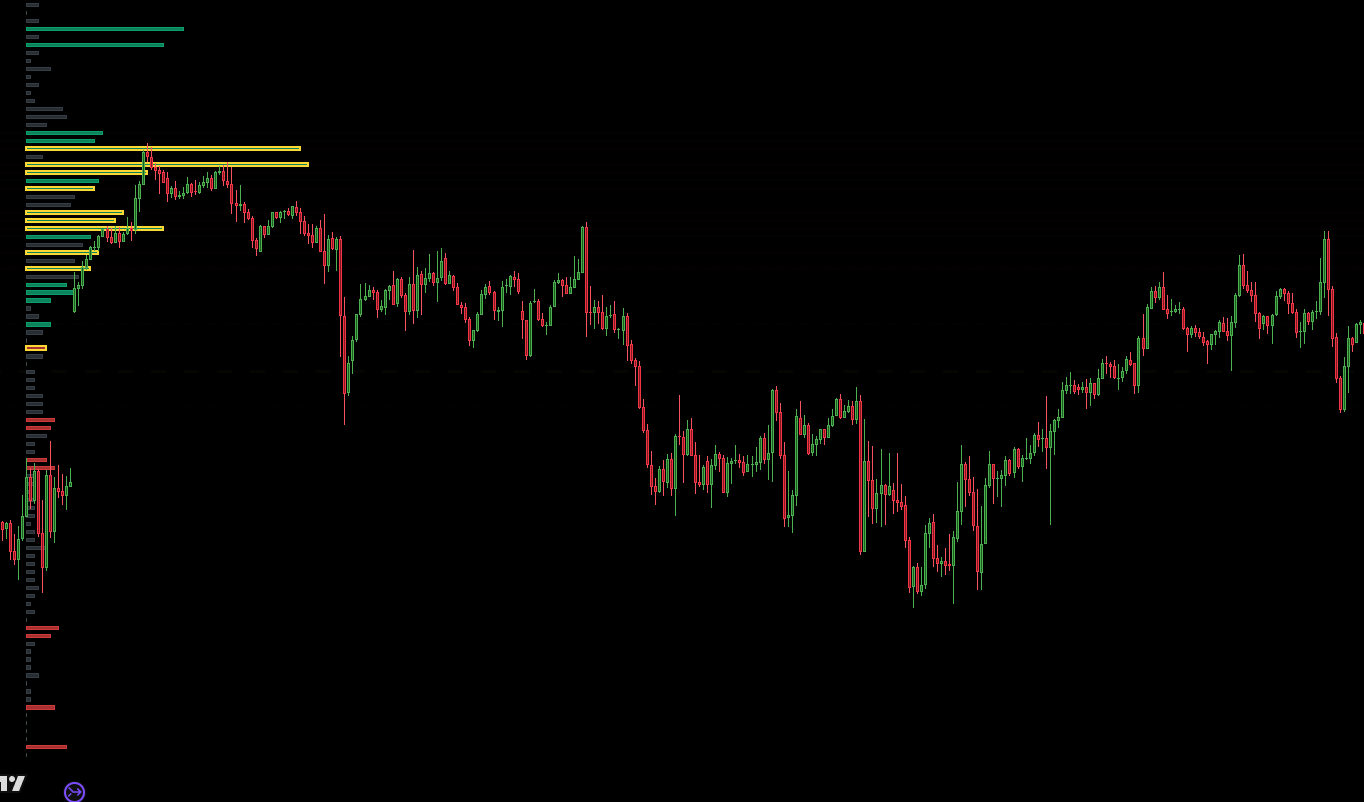
GEX PROFILE (LEFT) & WPF HISTOGRAM
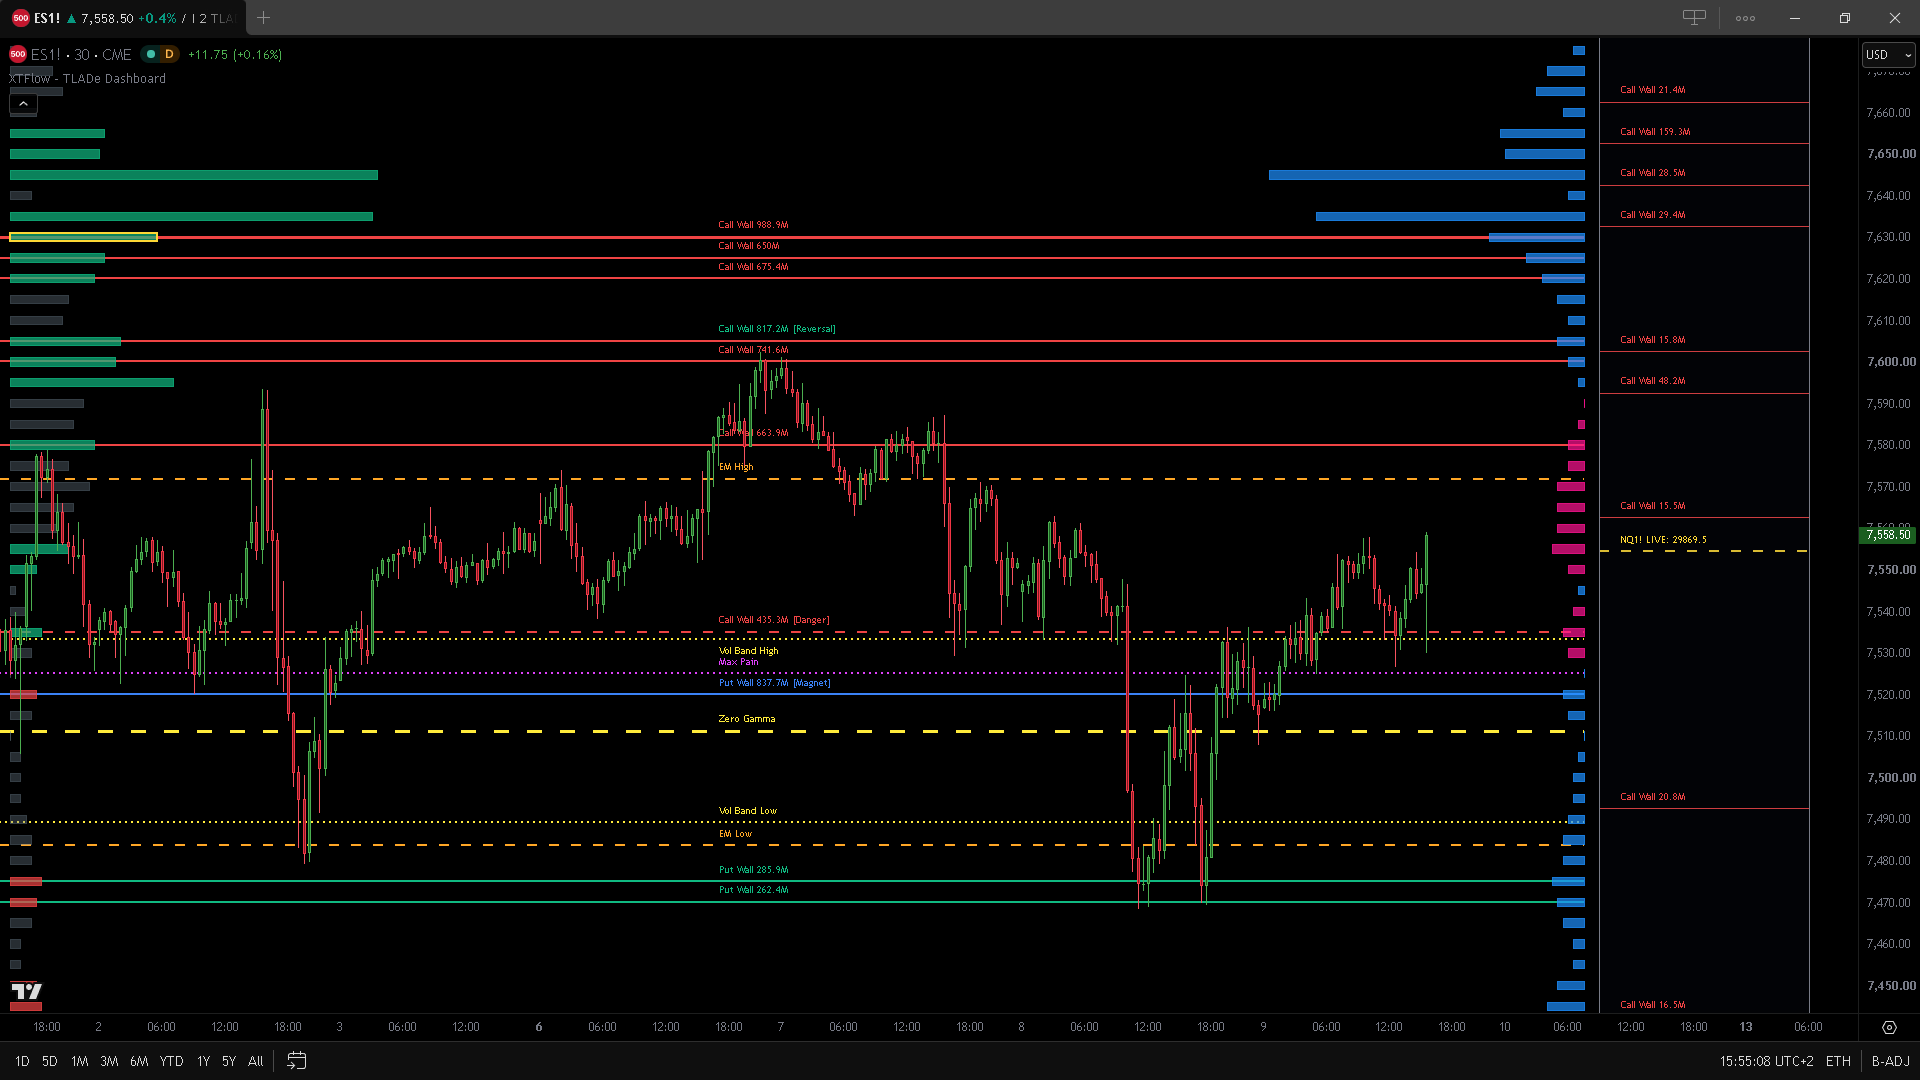
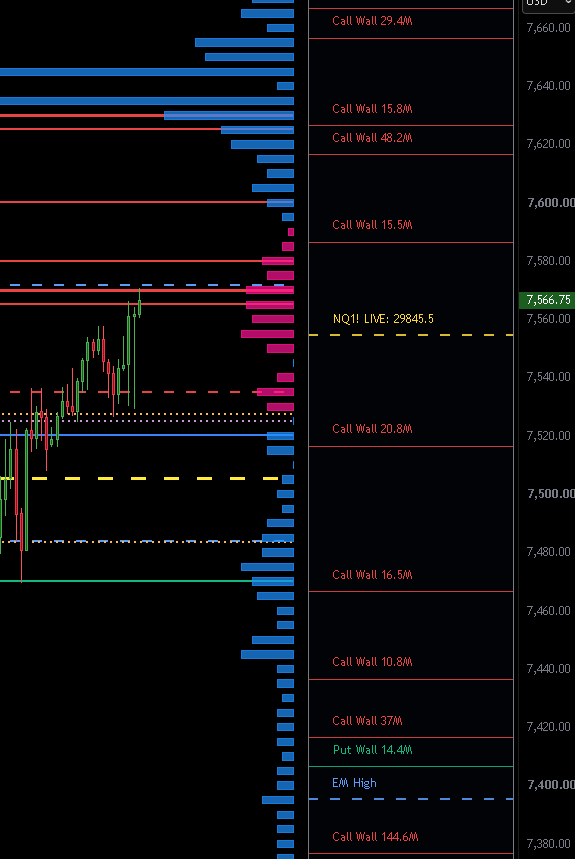
The horizontal histogram generated on the left side displays net dealer Gamma Exposure distribution by strike. Built on the proprietary WPF (Wall Profile Flow) framework, it structures:
- Strike Price: Vertical price axis positioning.
- GEX Magnitude: Bar width directly proportional to net exposure mass.
- Sign: Put (emerald green) and Call (crimson red).
- Top GEX Dynamic Borders: Automatic yellow highlighting on peak net volume levels.
- HL Interaction (Soft Filter): Slate gray desaturation with 65% opacity for bars outside the active set, preserving macro context.
CONVEXITY PROFILE (RIGHT)
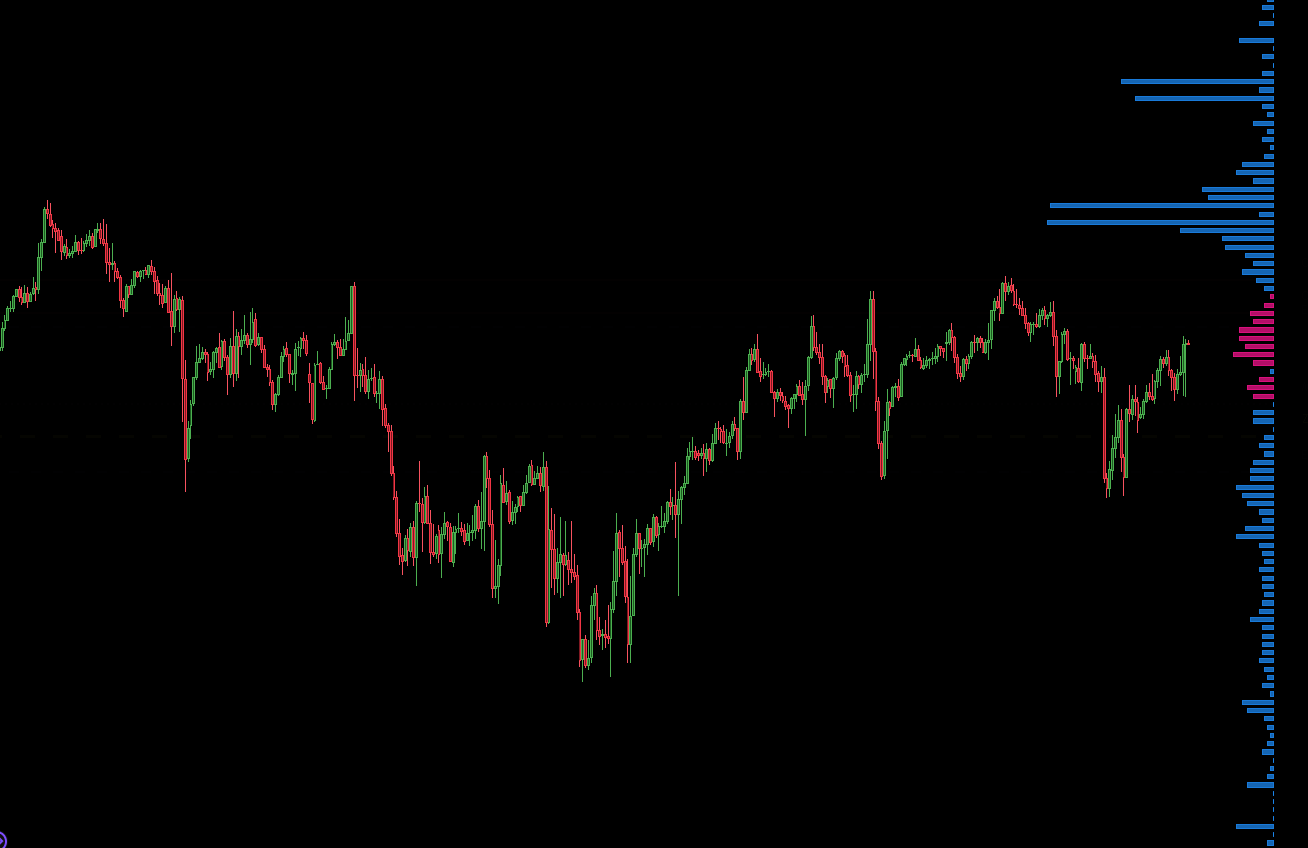
A symmetrical profile mapped on the right side of the chart tracks options chain Convexity.
- Mechanism: Measures the curvature (acceleration) of Gamma relative to price.
- Operational Application: Identifies rapid trend acceleration zones. As price enters high-convexity areas, mechanical dealer hedging amplifies non-linearly, triggering swift rejections or momentum runs.
SECONDARY PANEL INTEGRATION
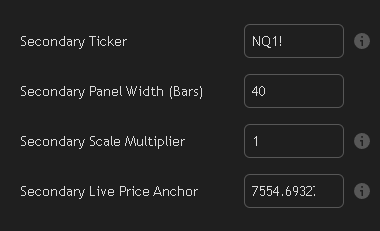
Specifically engineered to provide a competitive edge for NQ/NDX traders, this module offsets the lower liquidity and options data concentration on the Nasdaq chain by re-projecting dominant S&P 500 (ES/SPX) flows in real time. Because institutional delta-hedging and monetary volume are quantitatively primary on ES/SPX, the algorithm normalizes and projects broad-market GEX levels directly onto the NQ chart via an interactive scale (featuring sensitivity multiplier and draggable visual anchor). This allows NQ traders to leverage S&P 500 informational depth, heightening awareness of market reactions driven by SPX systemic barriers (Zero Gamma, dominant Walls, Expected Move).
INTEGRATED QUANTITATIVE DASHBOARD
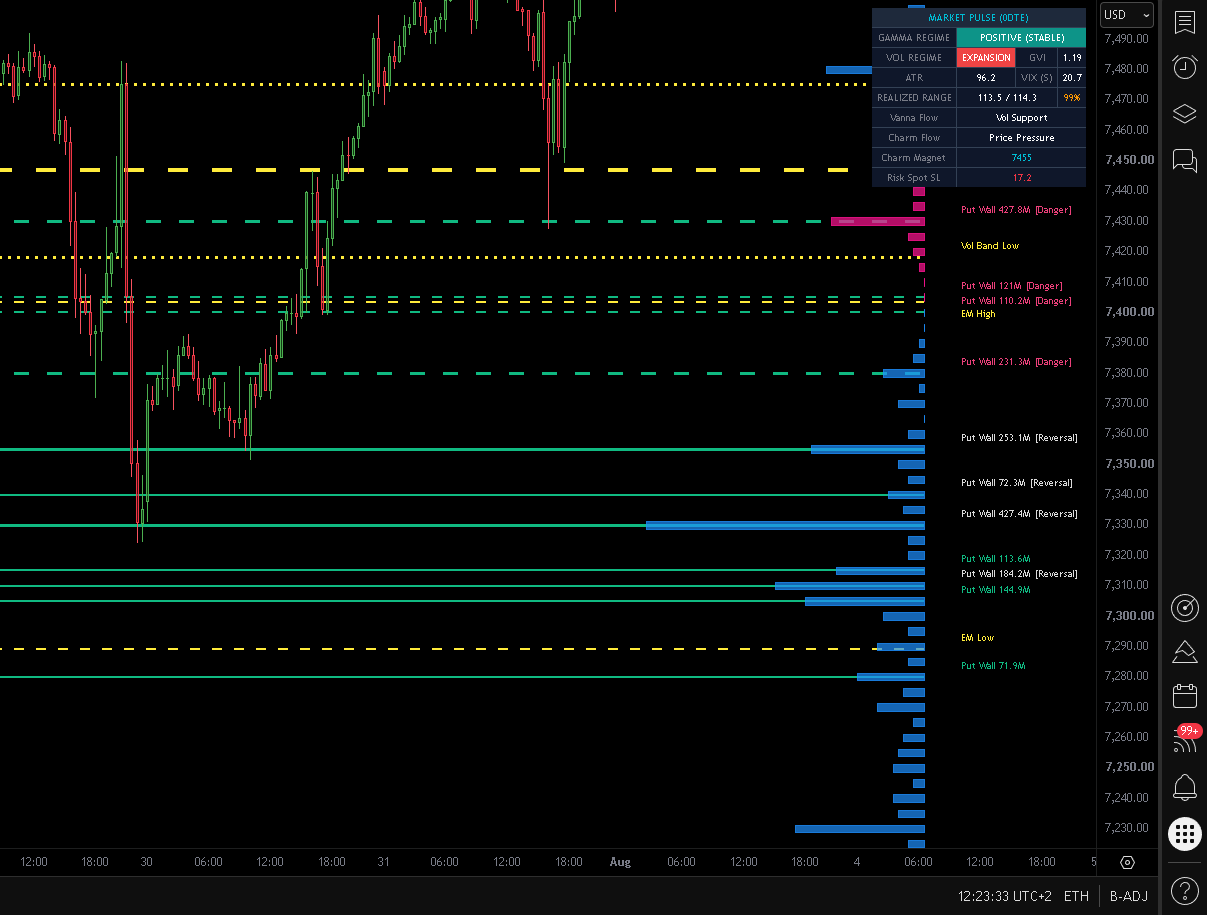
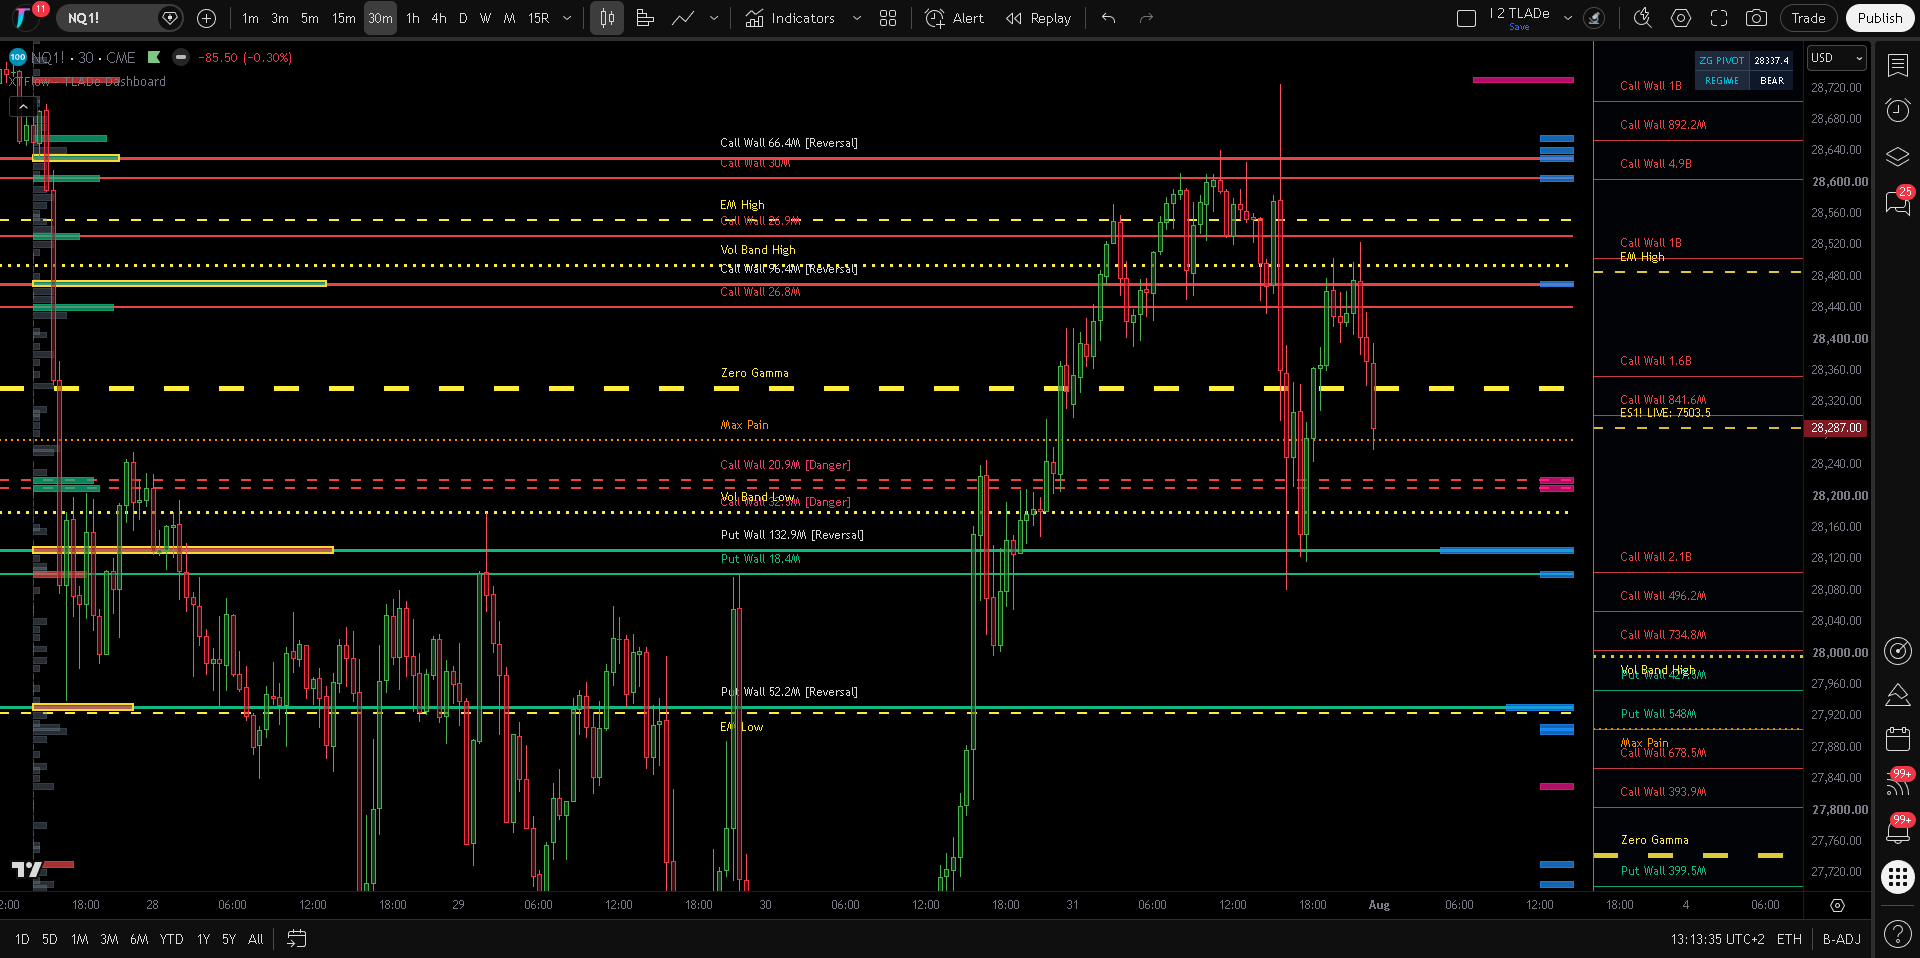
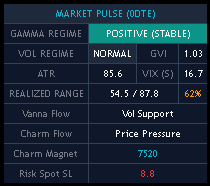
Positioned in the upper right section of the trading chart, the table serves as a comprehensive control dashboard for the active macrostructural regime. It synthesizes critical metrics to identify Greek flows at a glance:
- Gamma Regime: Signals whether the market environment is operating in a stable regime (Positive) or a volatility expansion regime (Negative).
- Vol Regime & GVI: Provides real-time insights into implied volatility compression or upcoming expansion phases.
- Realized vs Expected Range: Tracks intraday price expansion against theoretical expected movement limits.
- Vanna & Charm Flow: Highlights passive structural pressure exerted on price by time decay (Charm) or shifts in implied volatility (Vanna).
MARKET PULSE HUD WIDGET
DATA INGESTION VIA PAYLOAD (MANUAL)
The indicator does not calculate raw options data natively from historical price bars; instead, it processes external string payloads (Primary and Secondary Payloads) generated by institutional calculation engines and dedicated options databases.
Operational Execution: The trader inputs the generated payload strings directly into TradingView's input fields. This architecture guarantees that on-chart levels originate from external institutional options chain processing, bypassing platform computational limits.
The payload data required to power this indicator is provided exclusively by our partner feed provider TLADe. Purchasing the XTFlow indicator does not include a TLADe data subscription, which must be acquired separately.
OPERATIONAL SUMMARY & MARKET OVERVIEW
XTFlow - TLADe Dashboard is a quantitative analytical suite engineered to convert complex options chain mechanics into an immediate, actionable risk framework projected directly onto the price chart. By objectively detailing Gamma Exposure (GEX), automated Market Maker delta-hedging, and volatility regimes across 6 intraday sub-sessions, the suite eliminates subjective interpretation and highlights precisely where price intersects institutional liquidity.
The system empowers market participants to decode the structural impact of options-derived flows (Vanna, Charm, Convexity), grounding market analysis in the concrete order flow mechanics that drive tier-one financial intermediaries.