
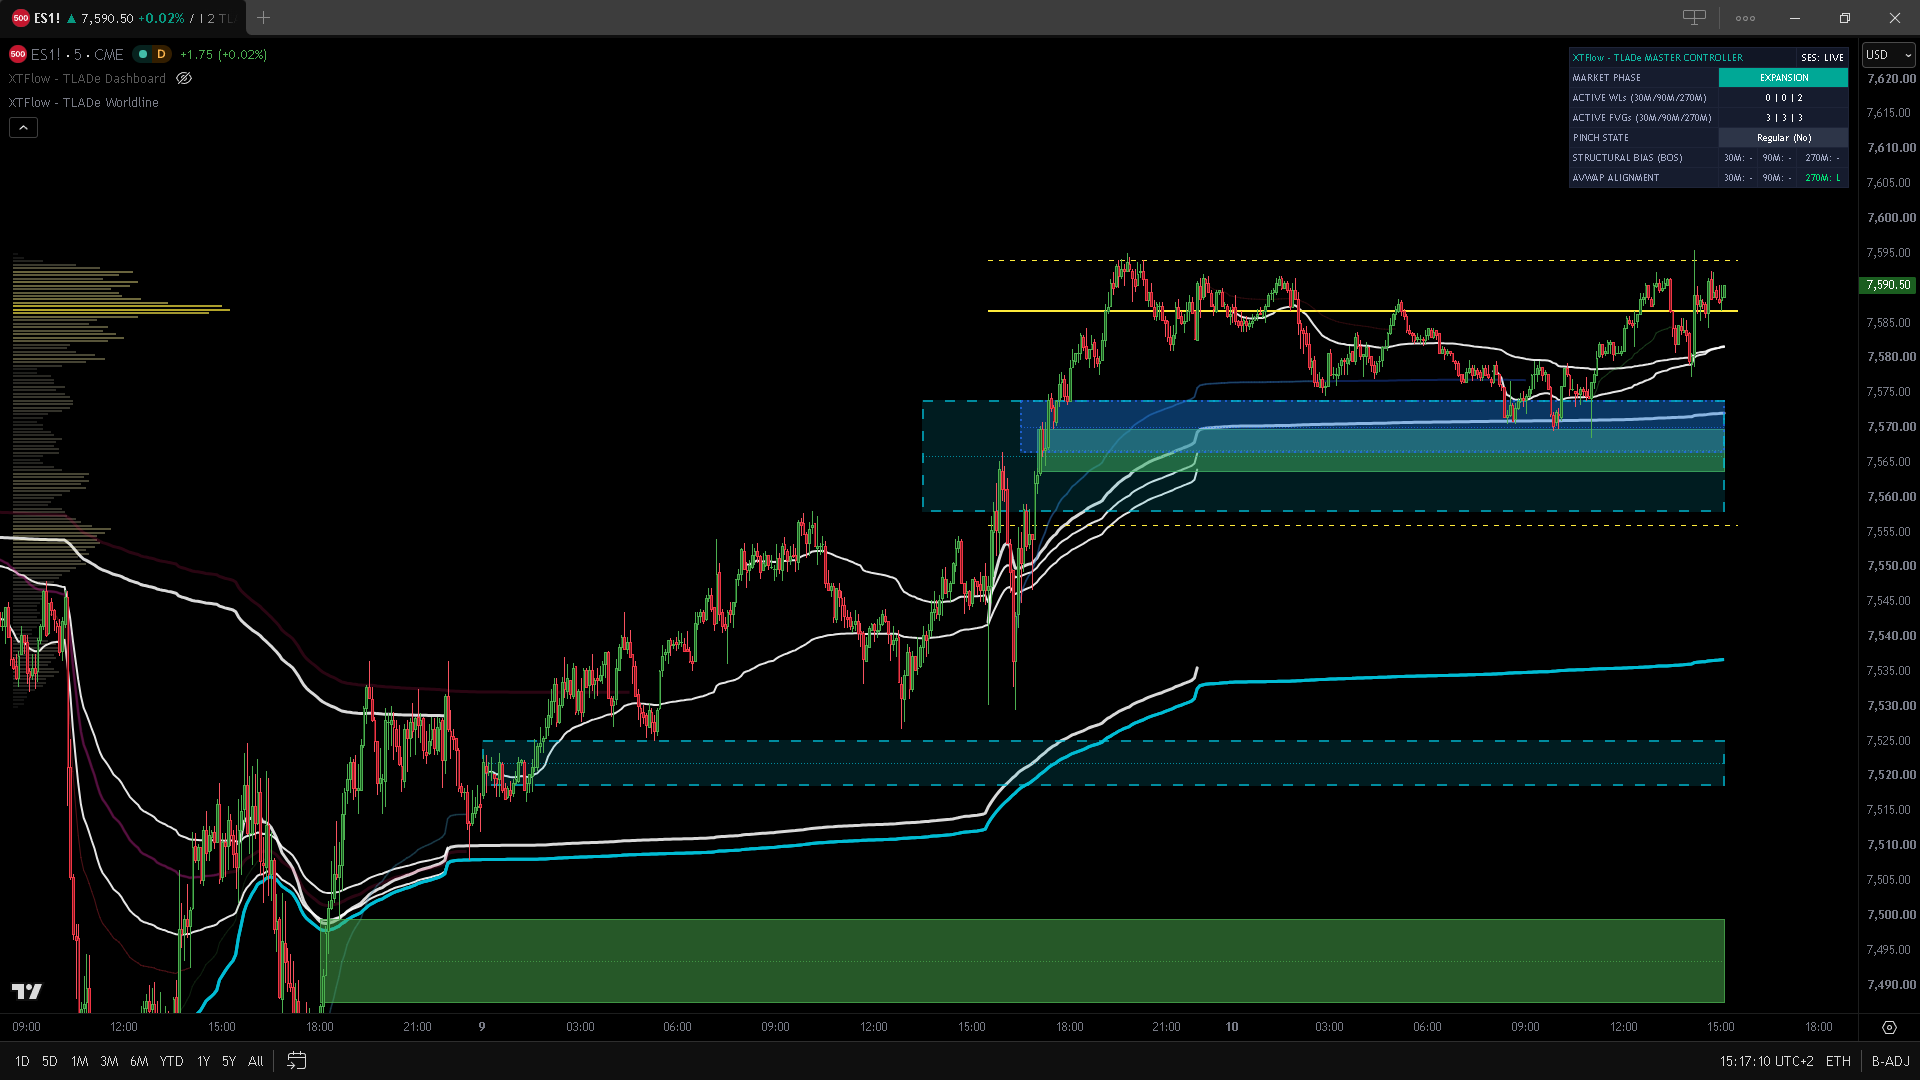
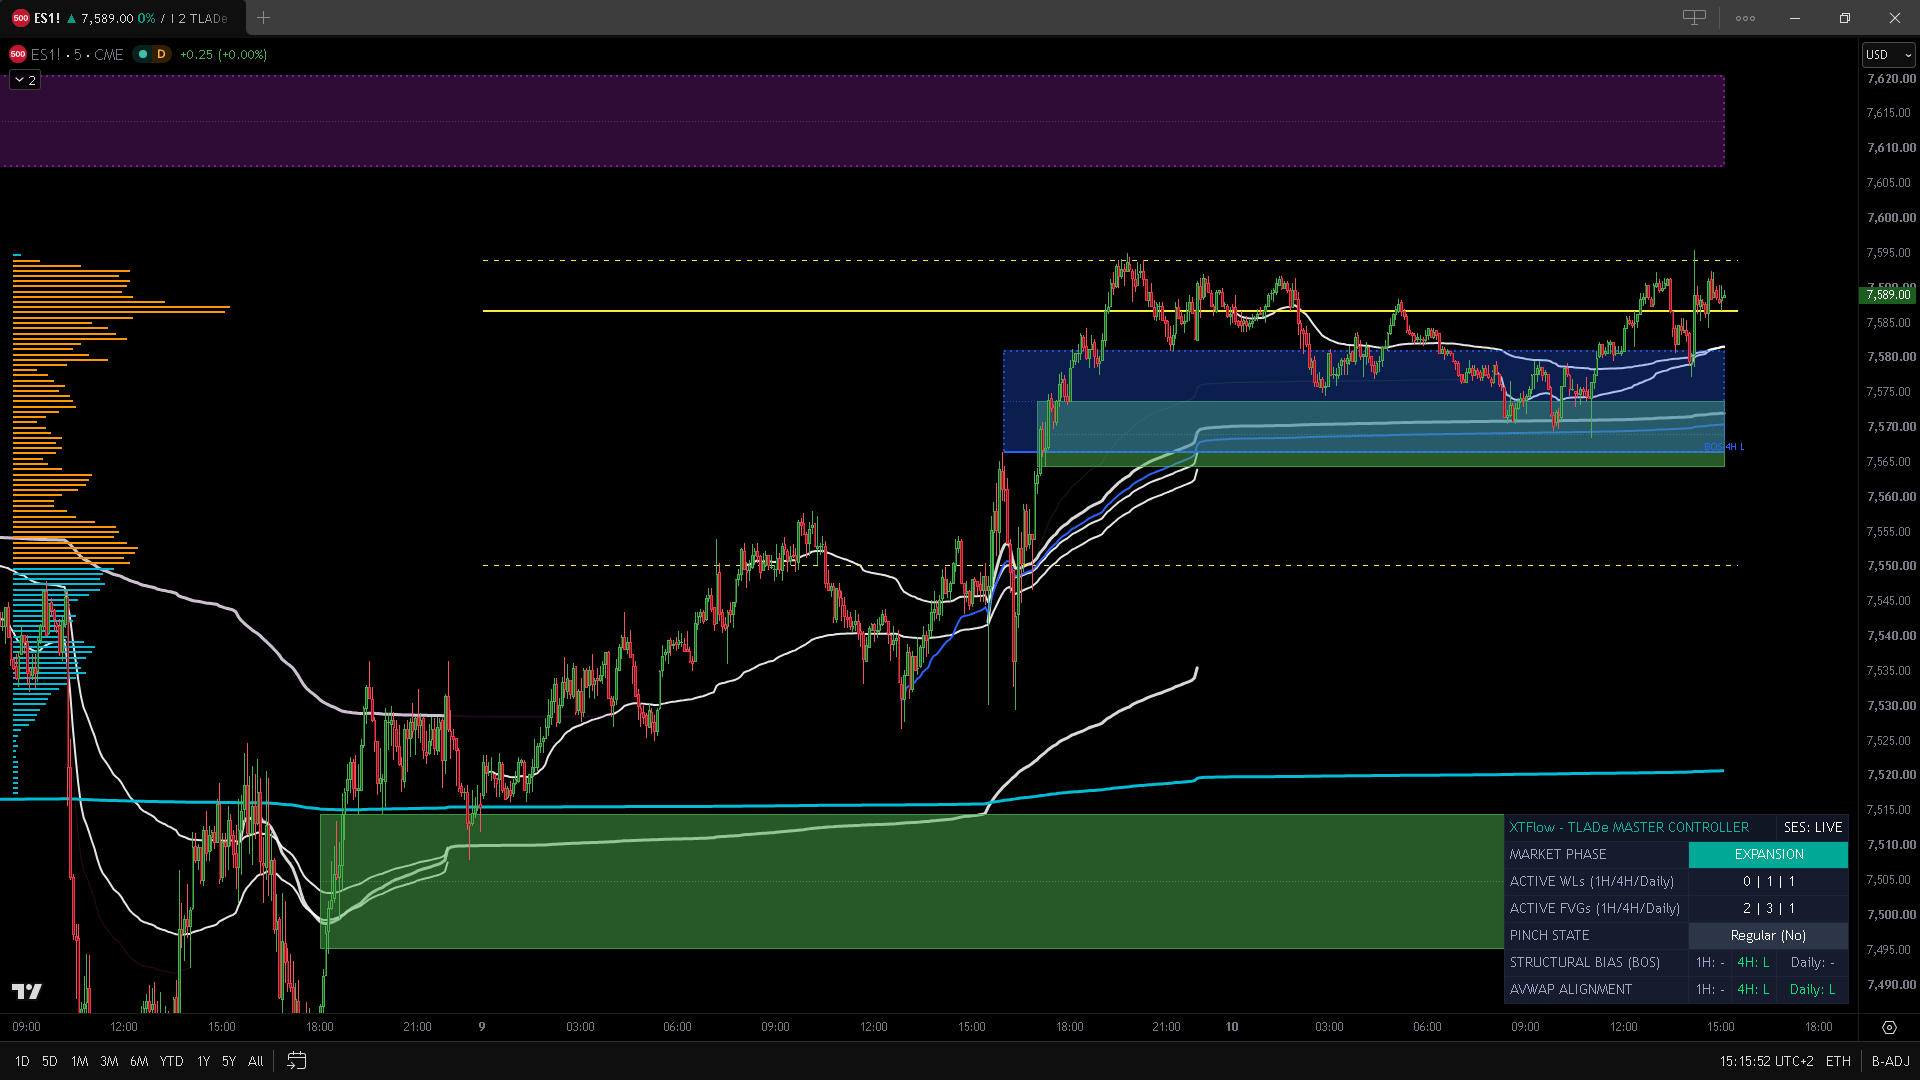
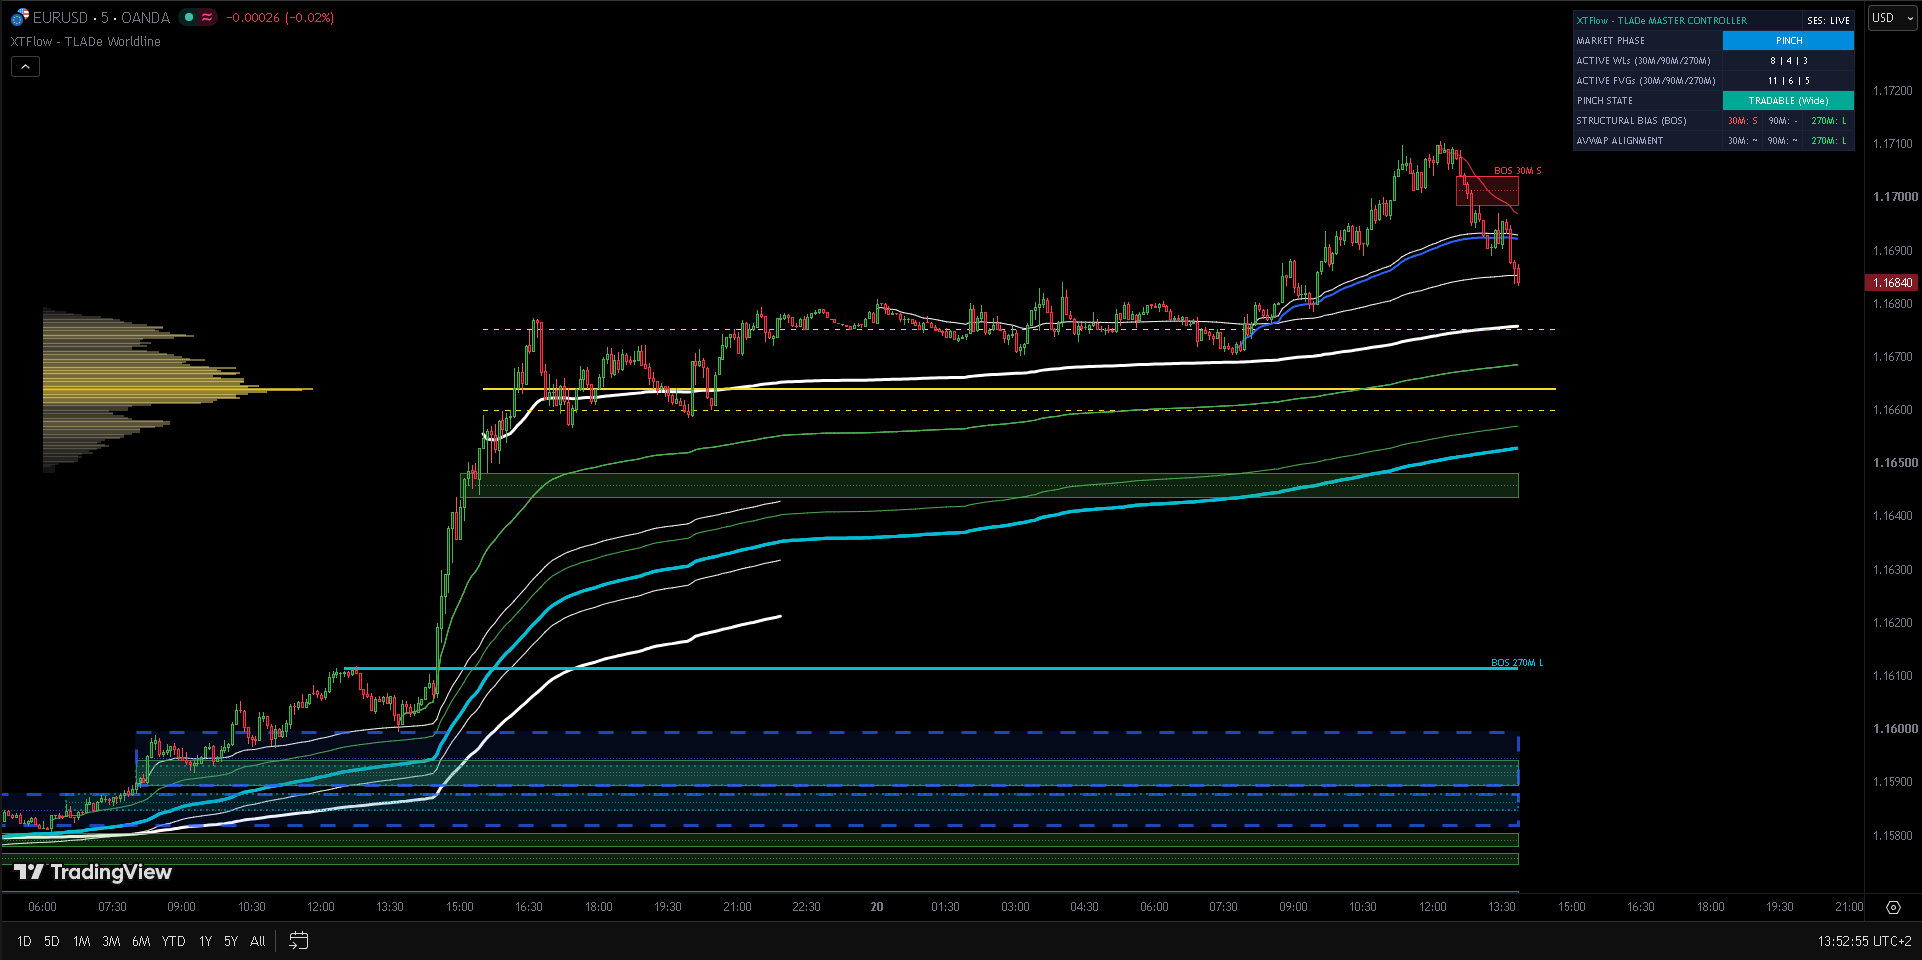
The Worldlines (AVWAP), Volume Profile areas (POC/VA), and Break of Structure (BOS) levels in this report represent analytical and simulated projections for educational purposes.
MULTI-TIMEFRAME INTEGRATION
The indicator simultaneously tracks and processes three distinct reference time horizons (TF1, TF2, and TF3), configurable across two calculation groups (Intraday or Daily), displaying them directly on your primary execution chart.
SESSION VOLUME PROFILE
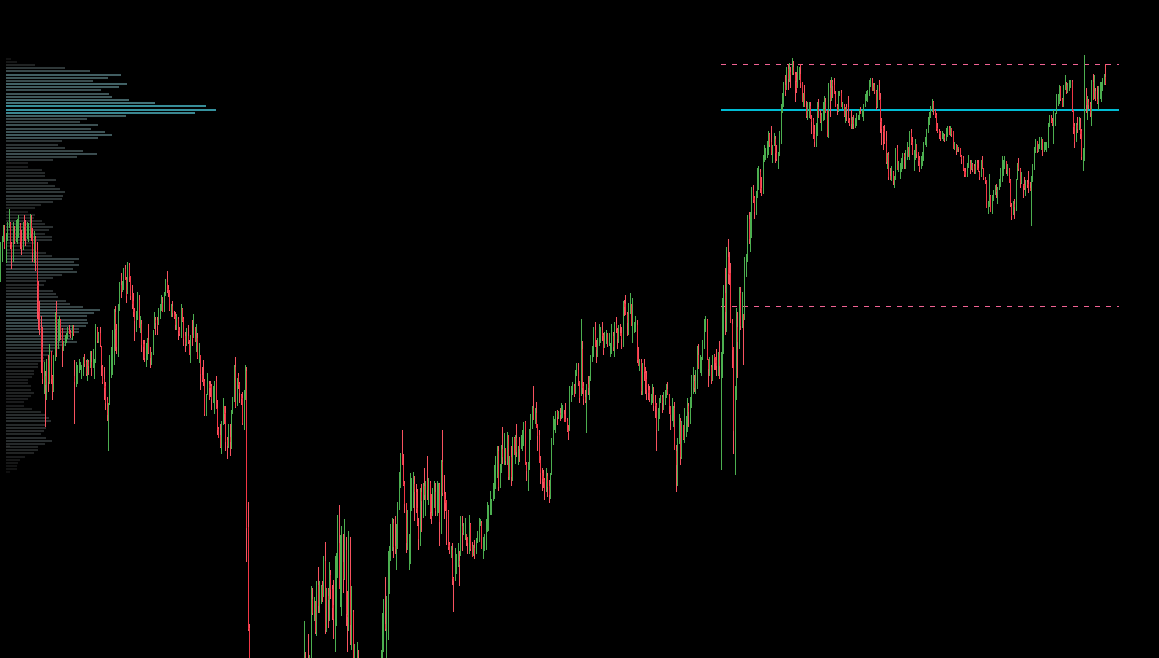
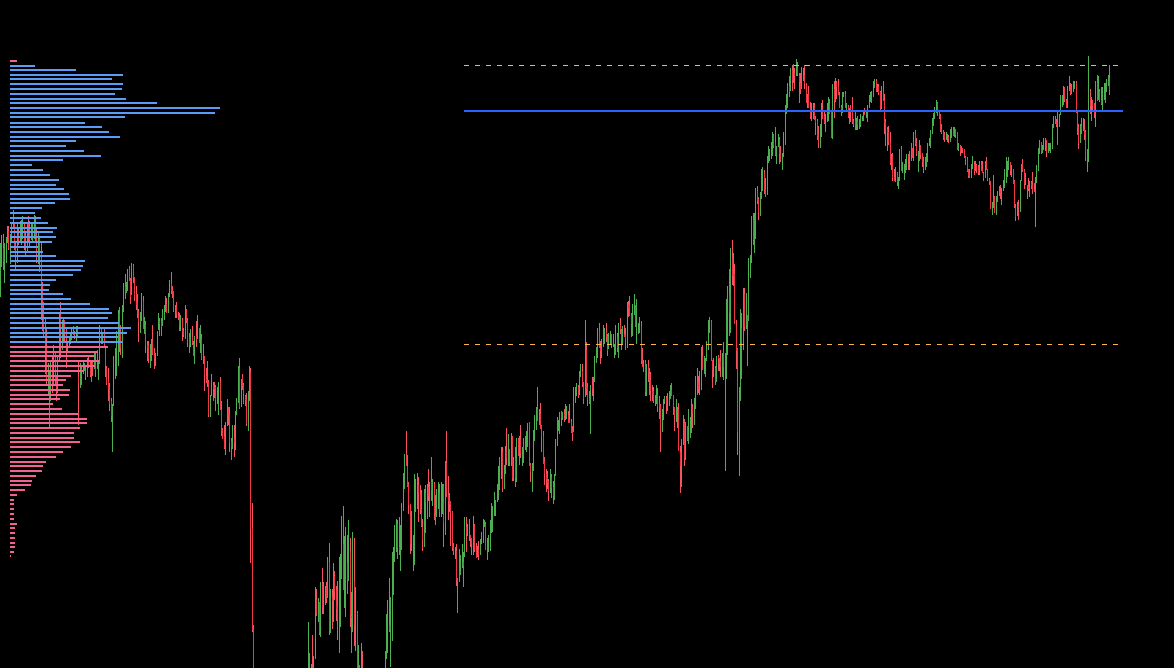
Volumetric analysis and net session flows (RTH / 24H):
- Point of Control (POC): A highlighted horizontal line identifying the single price level where the highest trading volume was concentrated during the concluded session.
- Value Area (VAH / VAL): Boundary lines enclosing the price zone where the majority of total session volume (e.g., 70%) was executed.
- Adaptive Histogram: Visualizes volume density with custom color gradients or distinct visual contrast between inside and outside the Value Area.
Operational Impact: The POC and Value Area boundaries (VAH and VAL) act as key dynamic support and resistance zones for the current and subsequent trading sessions.
EVENT AVWAPS (WORLDLINES) AND SESSION AVWAPS
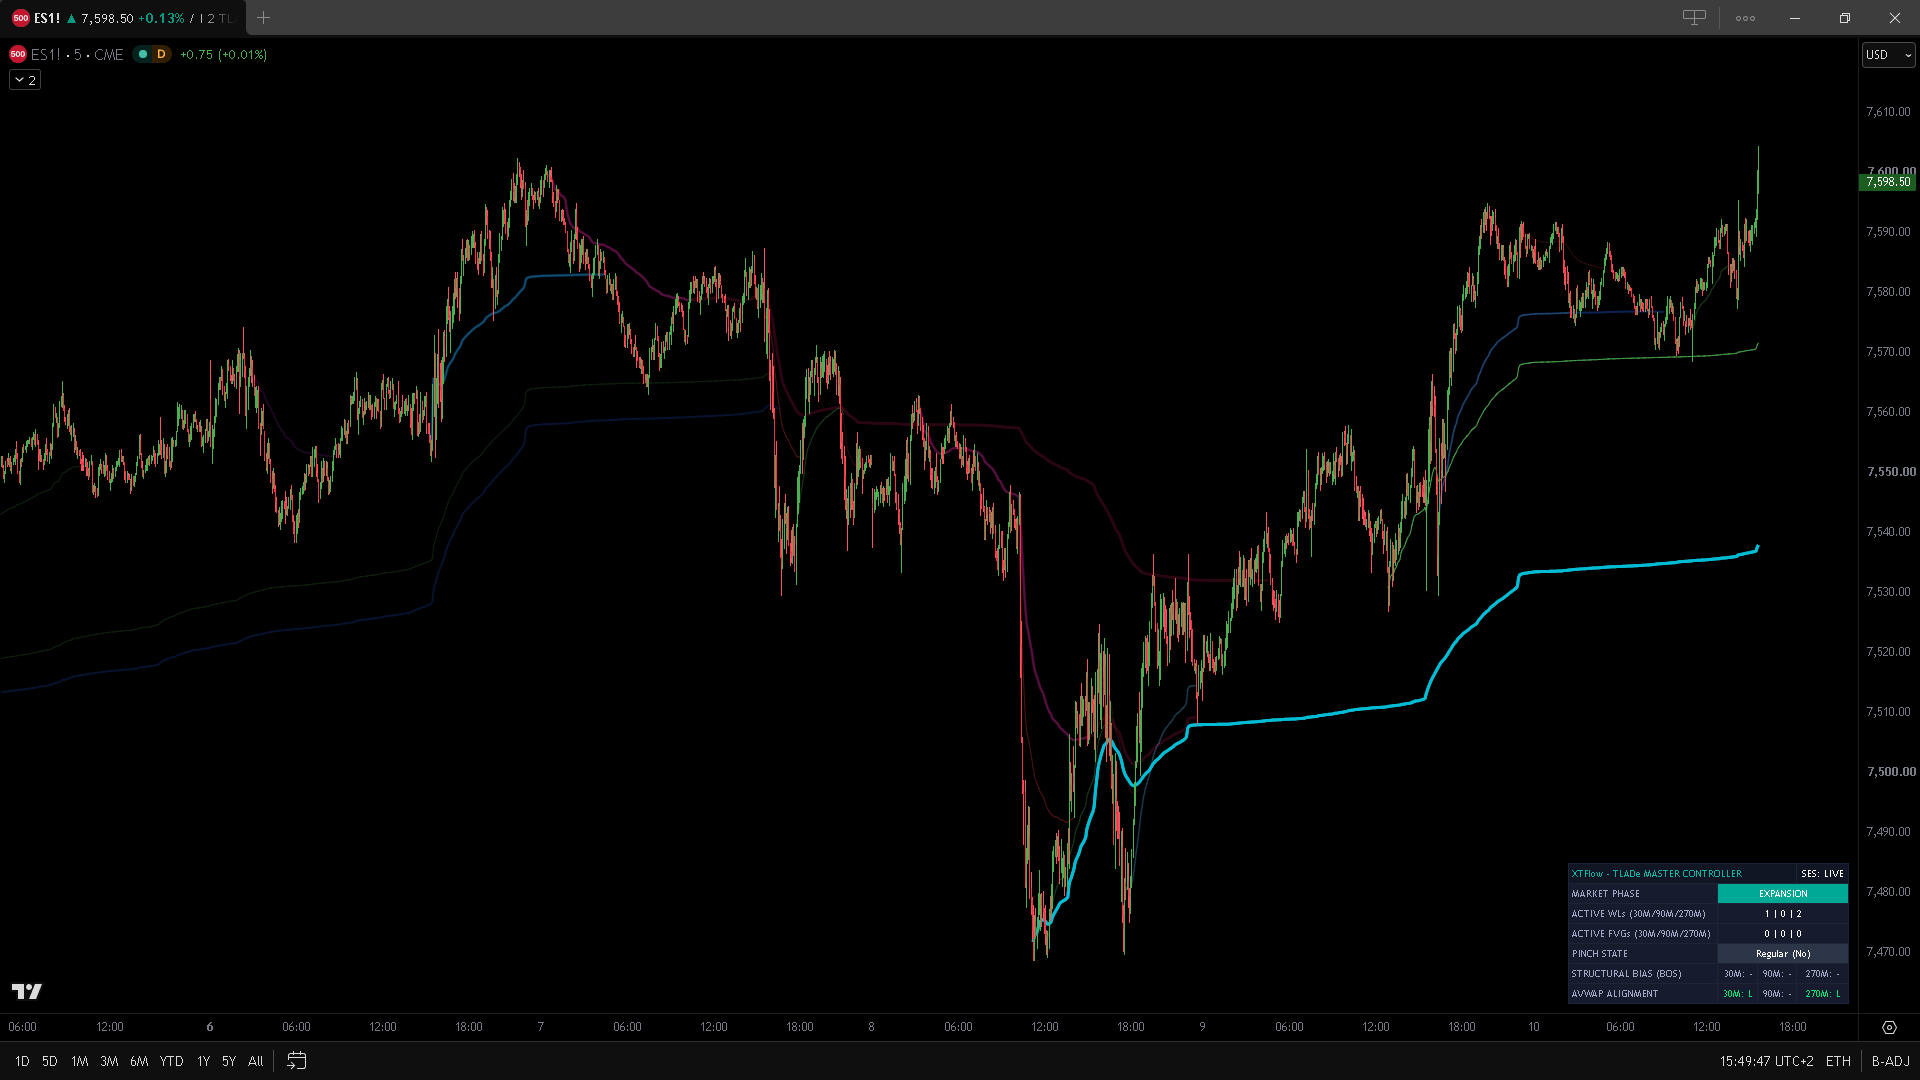
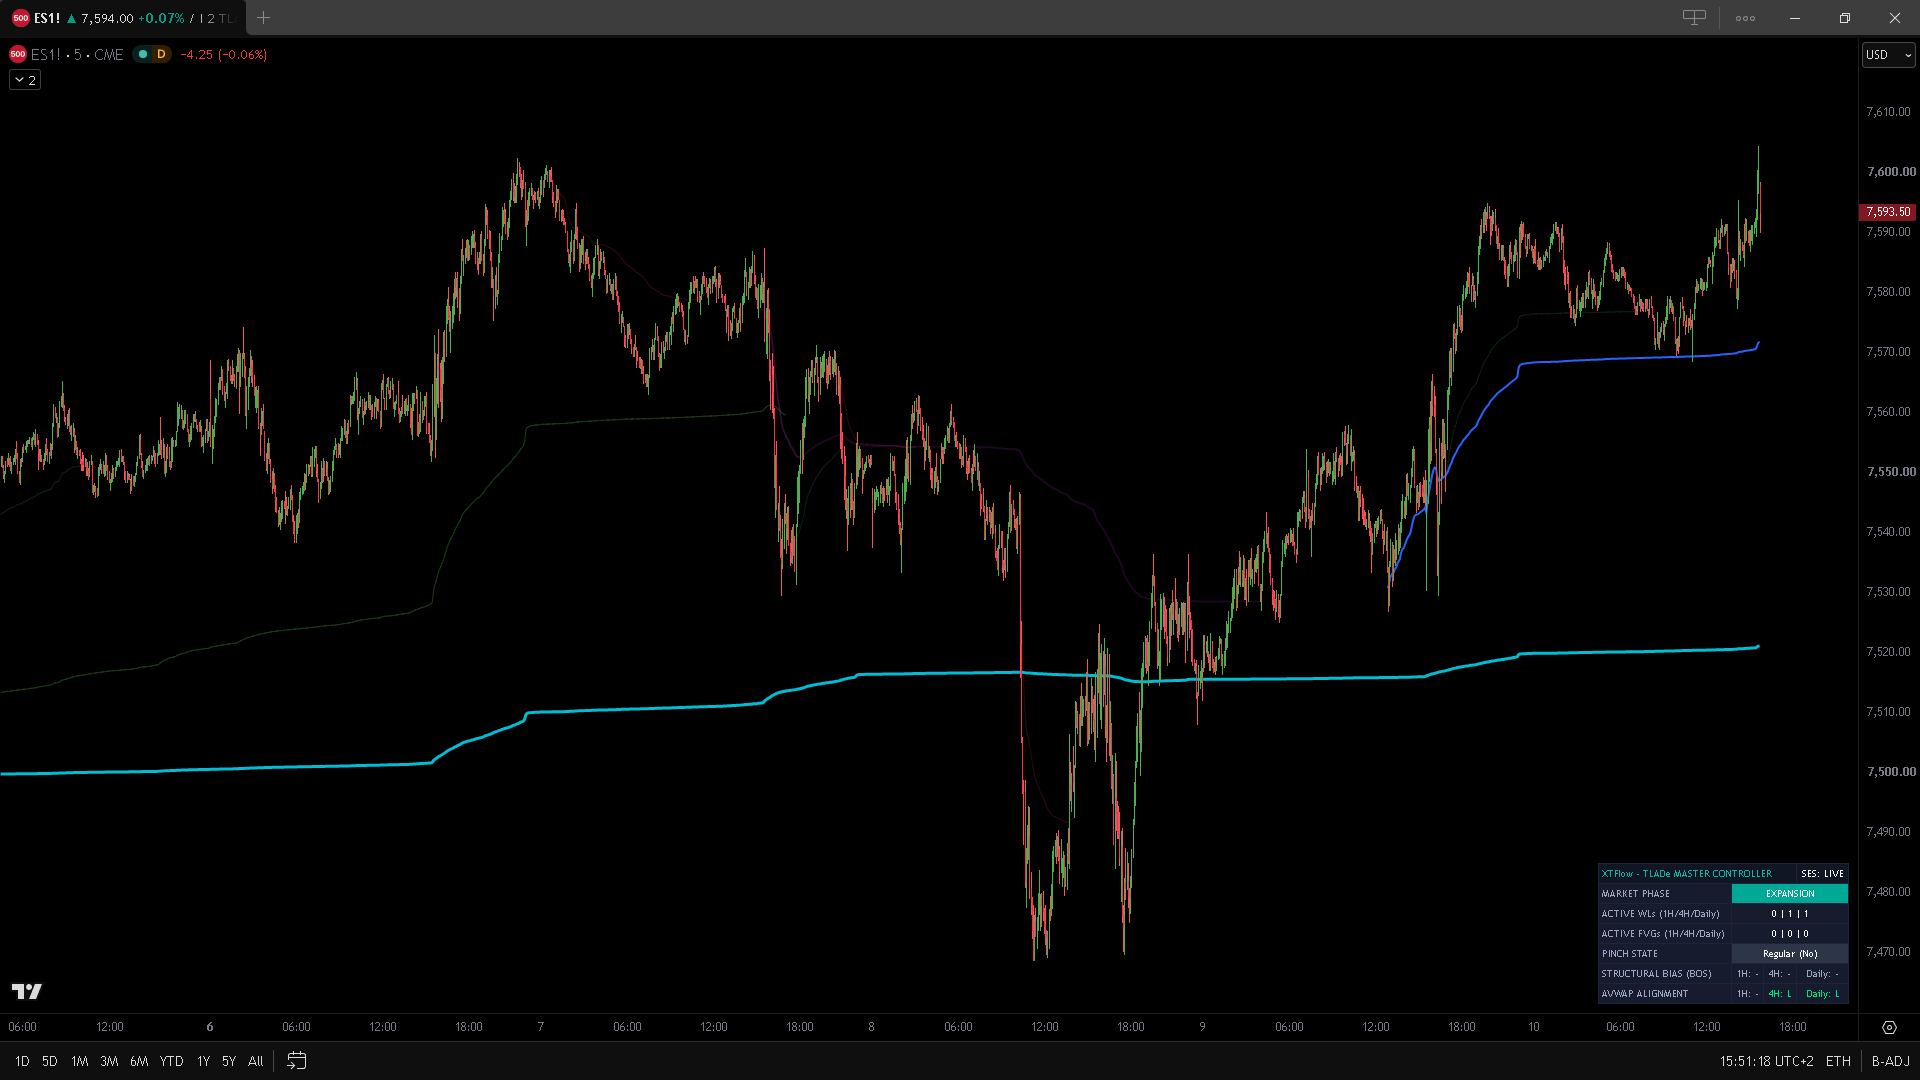
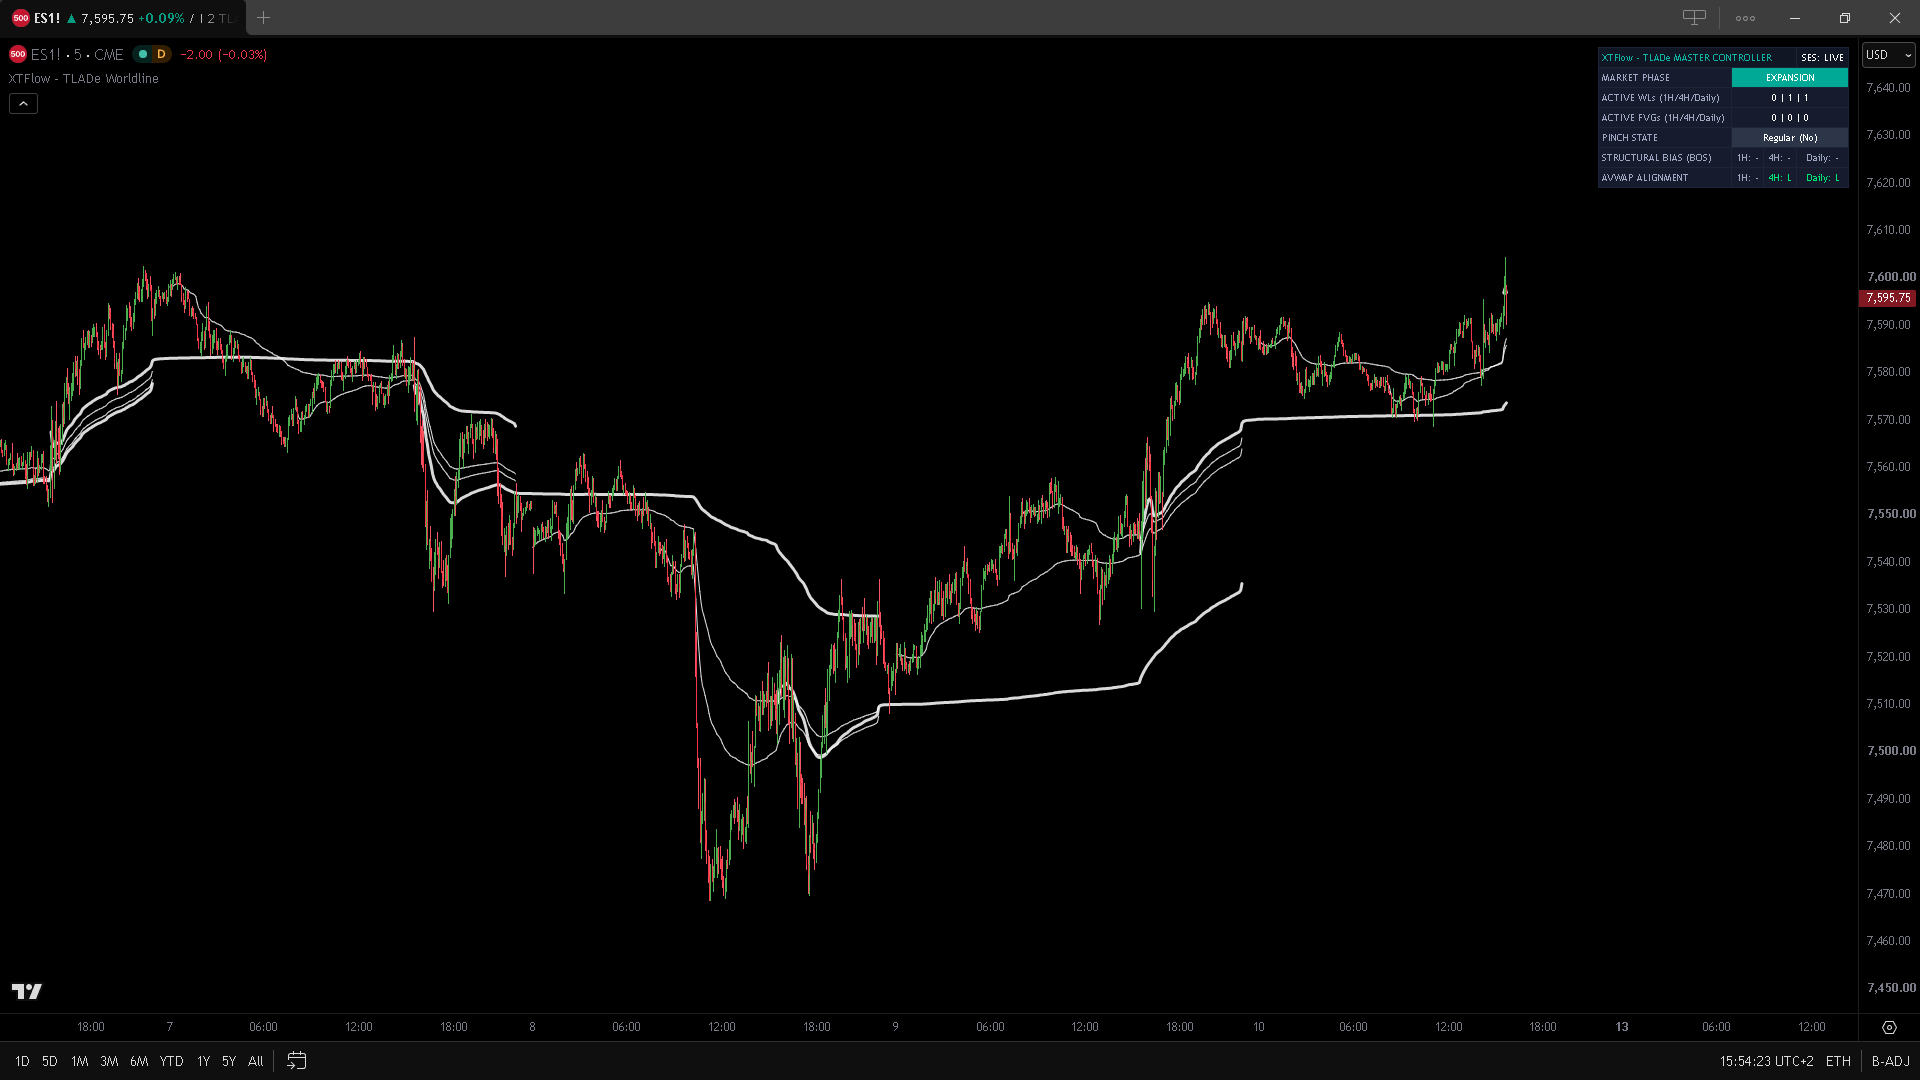
Dynamic tracking of volume price anchors (VWAP / AVWAP):
- Event AVWAPs (Worldlines): Volumetric price benchmarks anchored to significant structural events across all three timeframes. Rendered in an Active state as solid lines, and shifting to a Disabled state with faded styling when breached by price.
- Session AVWAPs: Fixed time-anchored volumetric levels tied directly to the opening of major global trading sessions (Asia, Europe, and US sessions).
FAIR VALUE GAPS (FVG) AND POST-MITIGATION RETEST AREAS
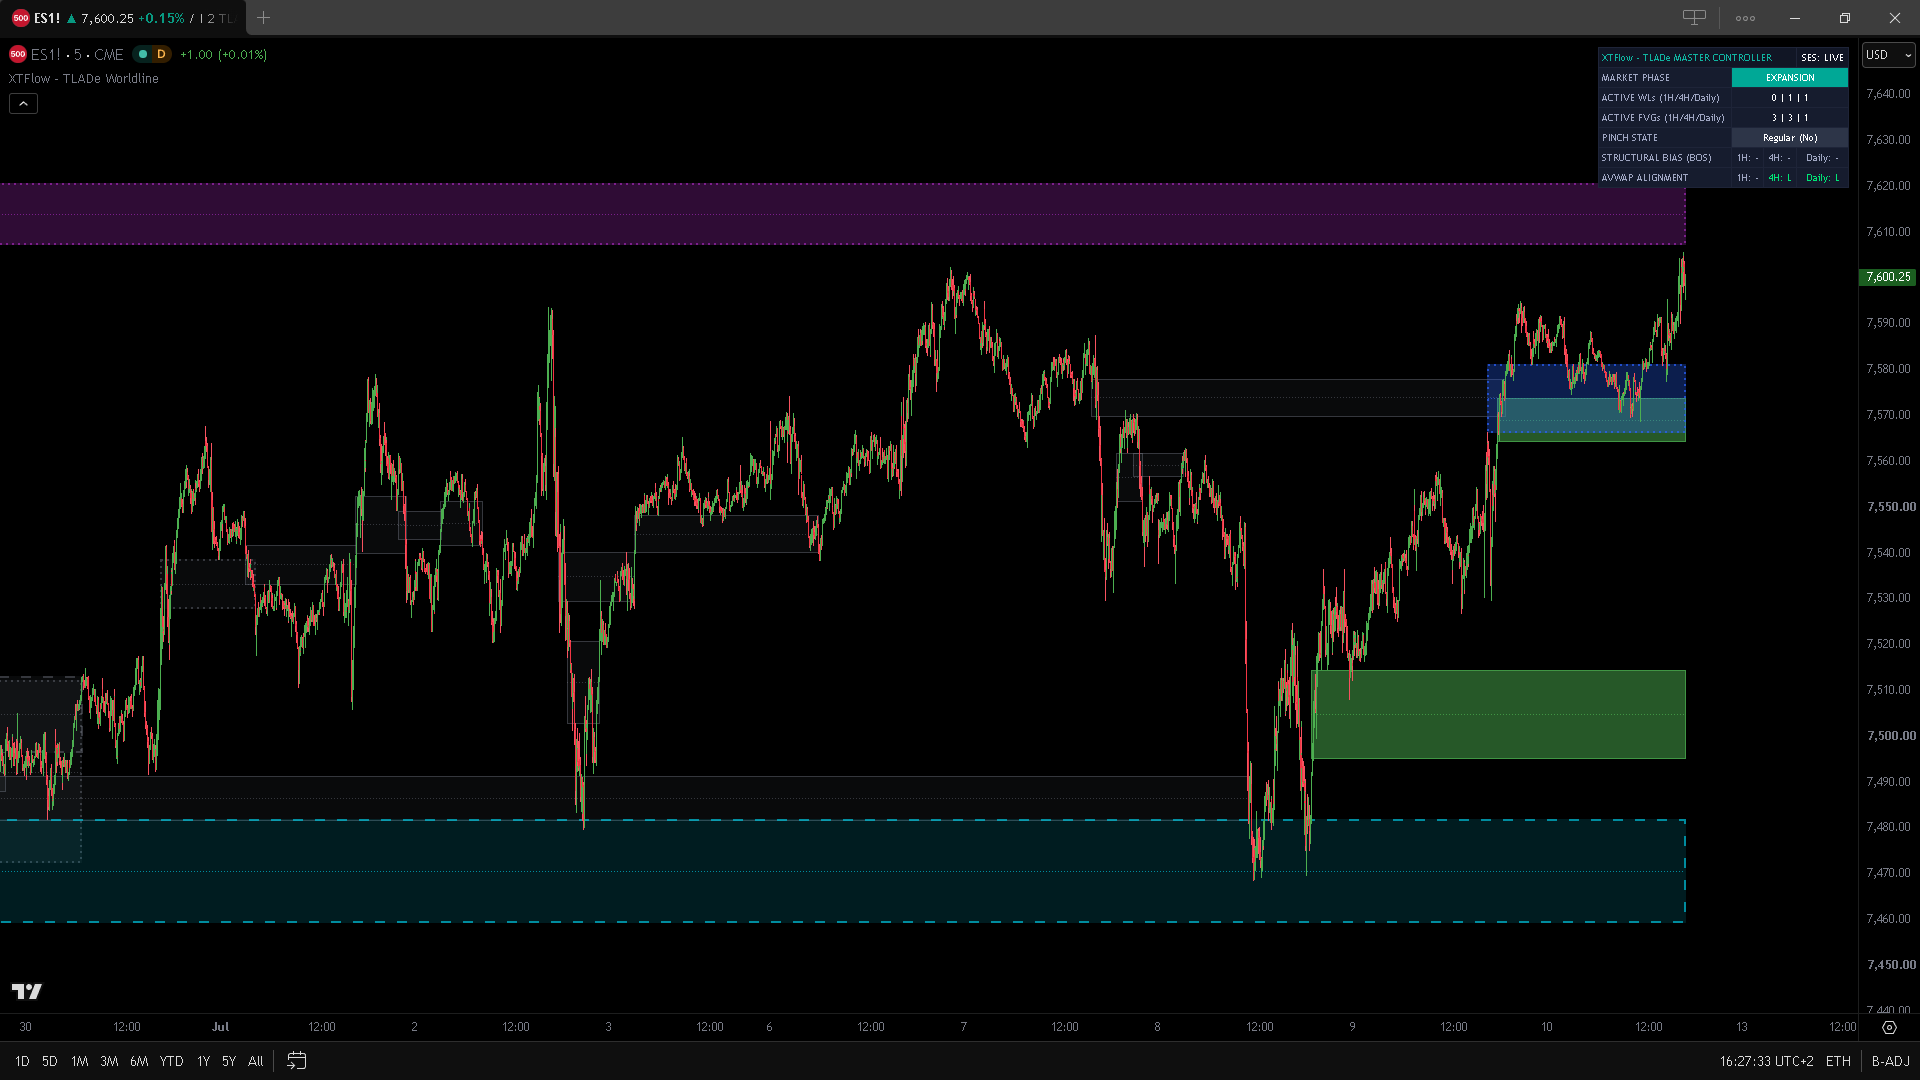
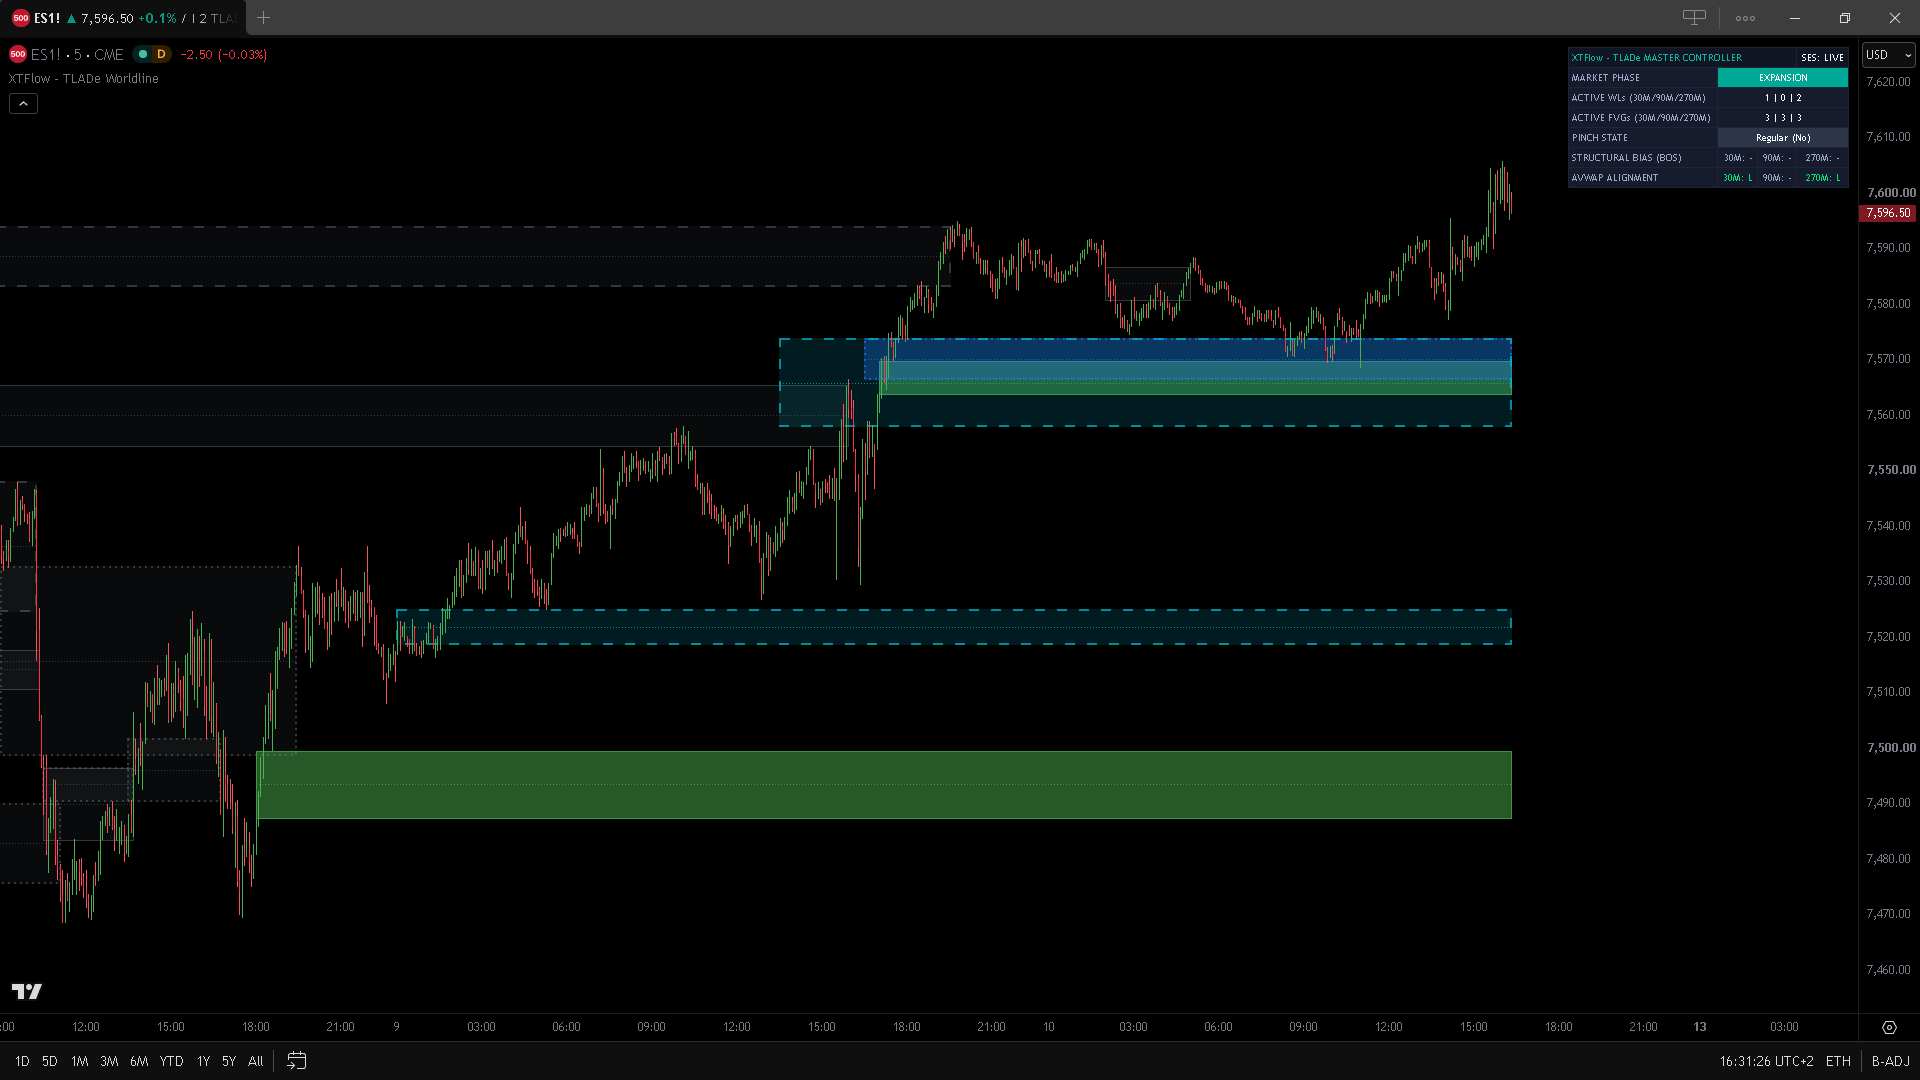
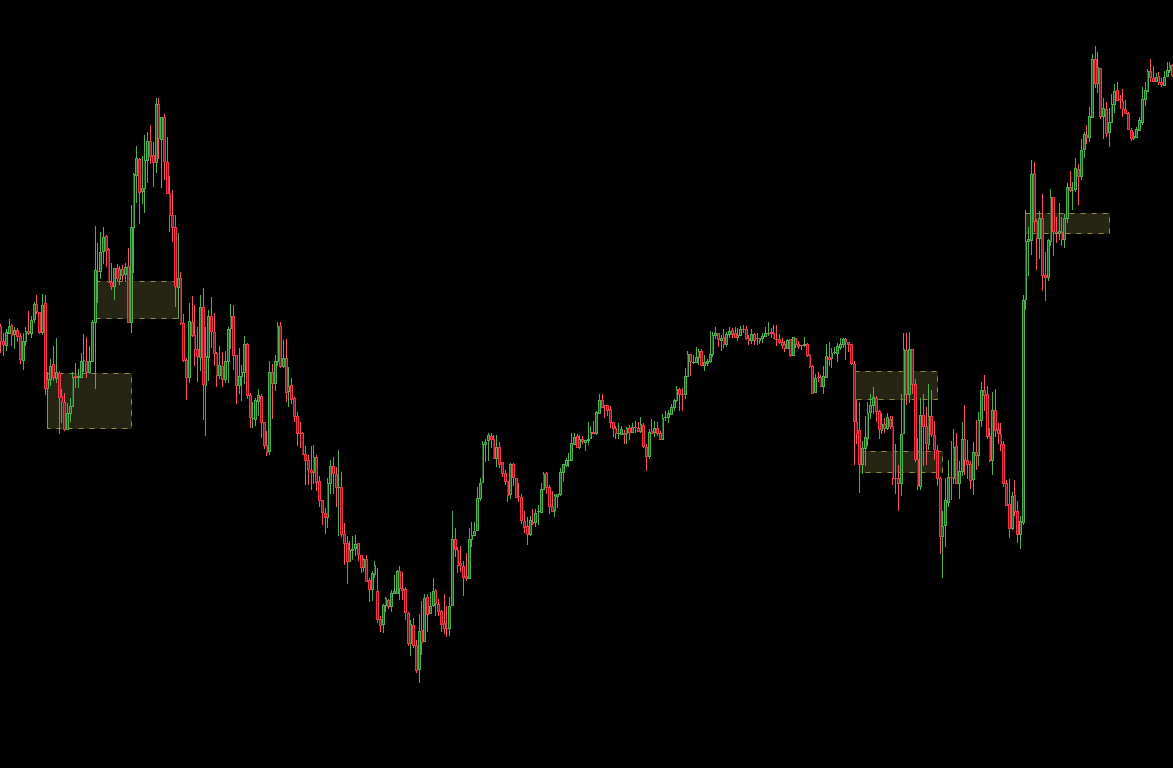
Mapping market imbalances and median levels:
- Gap Tracking (FVG): Upon rapid price expansion creating liquidity voids, the tool renders a color-coded box and projects the 50% median line.
- Dynamic Mitigation: Once price fully fills the gap, the box shifts to a neutral, faded tone to signal completed liquidity rebalancing.
- Retest Areas (Post-Mitigation): Immediately following gap mitigation, the script projects a temporary area of interest to monitor subsequent price pullbacks.
DYNAMIC BREAK OF STRUCTURE (BOS) LEVELS
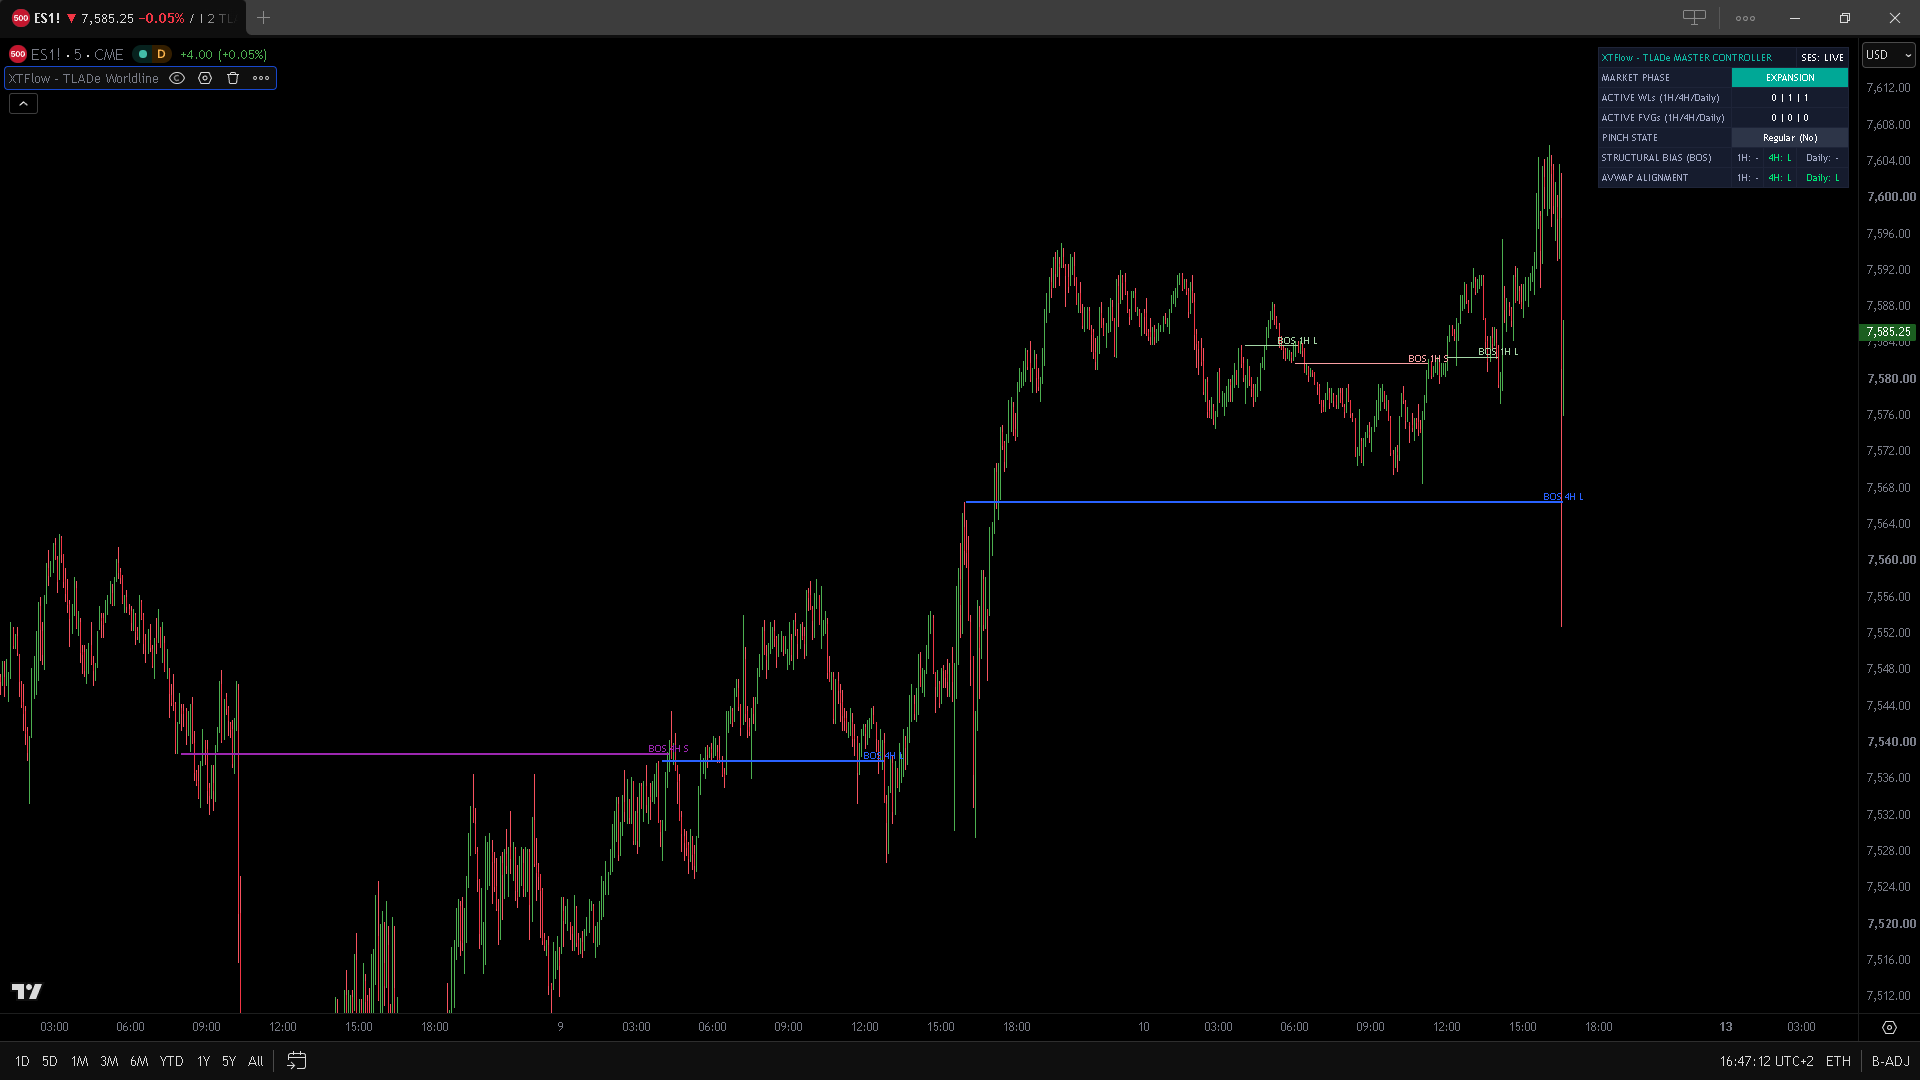
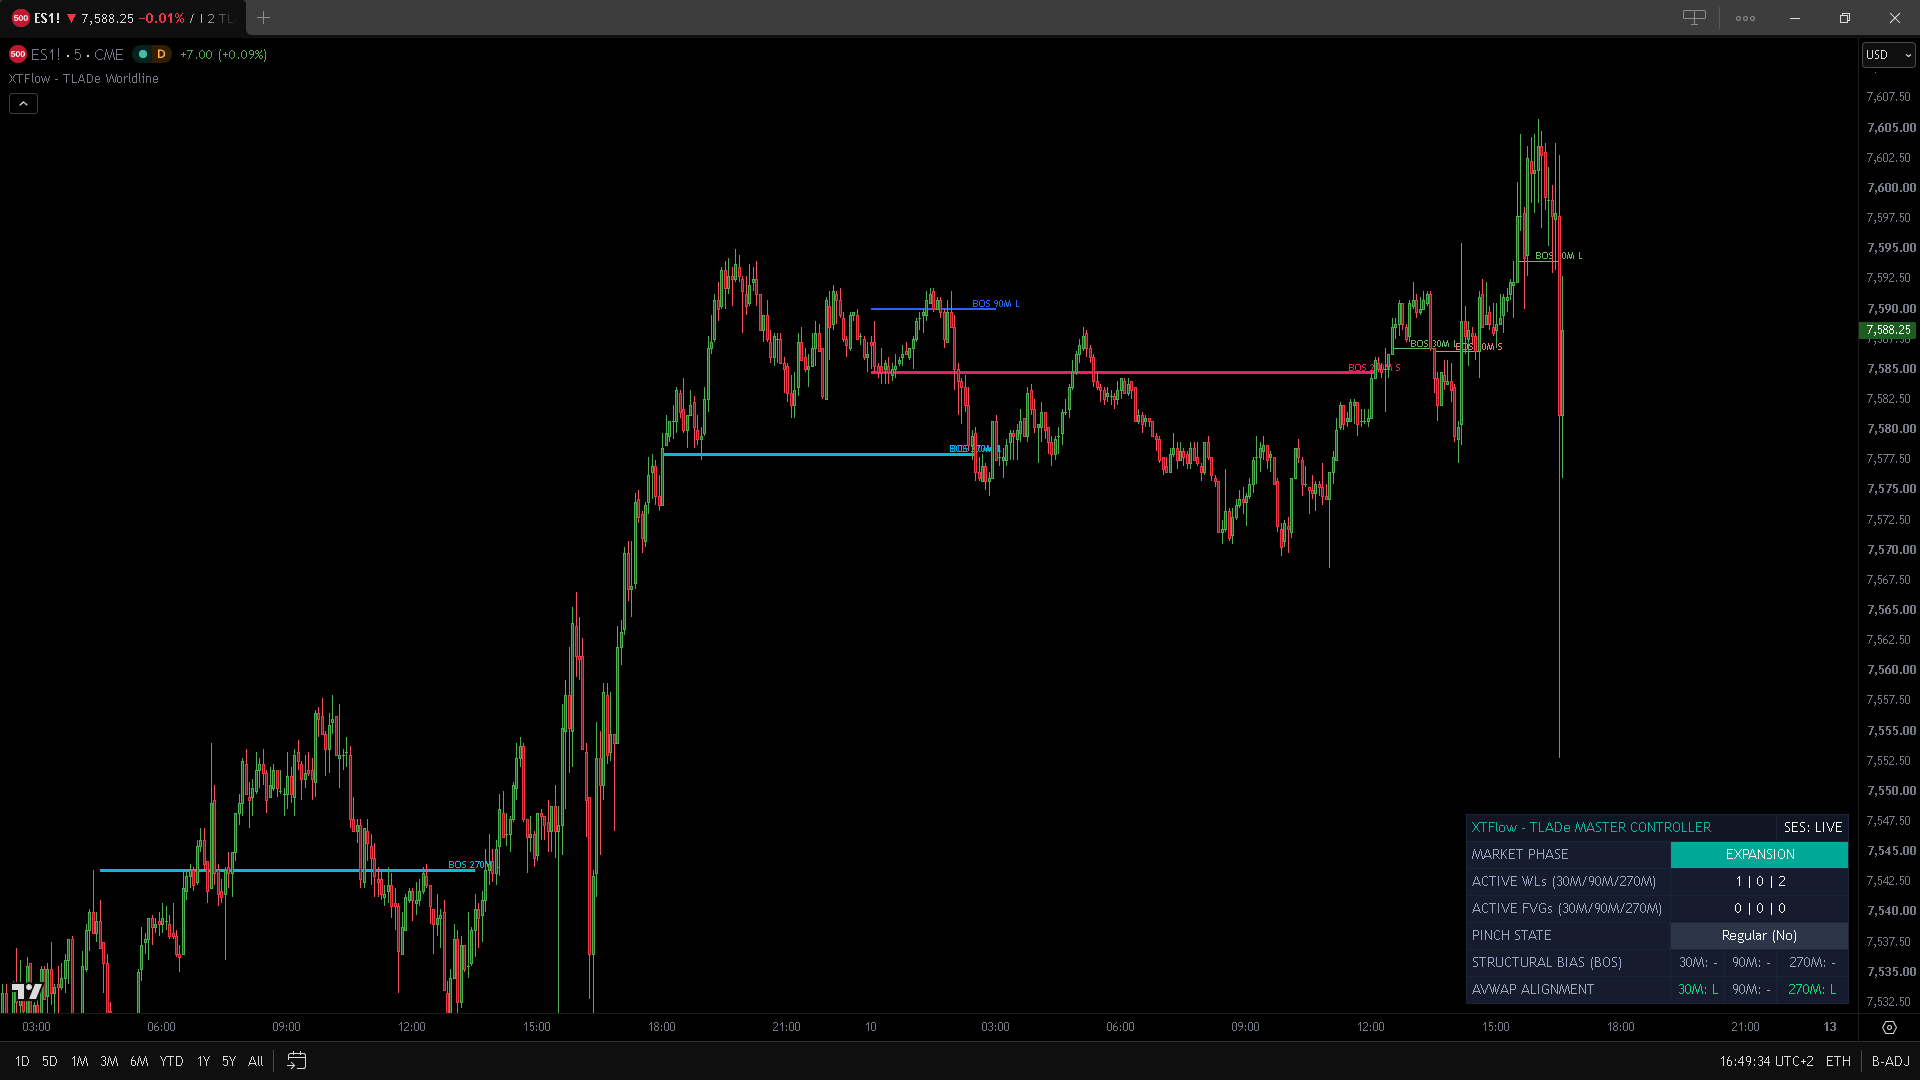
Structural analysis and breakout levels:
- Level Tracking: Identifies structural levels (BOS), projecting a direct reference line to confirm directional momentum (L = Long / S = Short) and its origin timeframe.
- Broken BOS Management: If price subsequently breaches the structural level in the opposite direction on its origin timeframe, the reference line is not deleted but faded to indicate completed structural invalidation.
DYNAMIC FILTERS AND SIGNAL CONFLUENCE
Signal optimization and volatility impulse engines:
- Consolidation Filter: Prevents new Worldline (AVWAP) generation when price is within a congestion or compression phase, filtering false signals during accumulation.
- ATR Impulse Filter: Validates market impulse quality, preventing trades on weak movements lacking sufficient momentum.
- Max ATR Filter: Identifies and rejects late or over-extended moves, preventing Worldline activation on exhausted impulses with unfavorable risk/reward ratios.
Operational Impact: Prevents execution during choppy, exhausted, or tightly compressed market phases, focusing attention exclusively on events carrying true continuation probability.
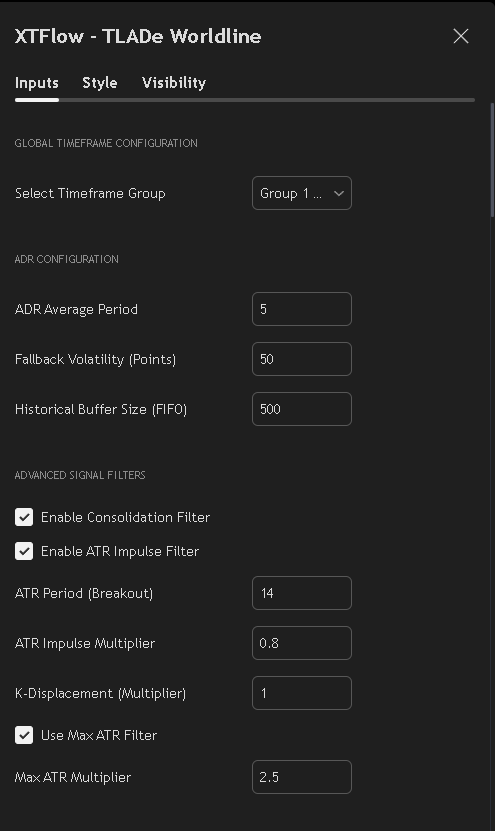
Fig. 6.1 - Advanced Signal Filters
MASTER CONTROLLER TABLE (WPF EMULATION)
Integrated cockpit and timeframe alignment:
- Market Phase: Indicates the active trend state across Consolidation (range-bound), Expansion (bullish), Collapse (bearish), or Pinch (compression).
- Active WLs / Active FVGs: Displays real-time counts of active, unmitigated Worldlines and Fair Value Gaps for each of the three timeframes.
- Pinch State: Identifies whether cyclical price compression is favorable for execution (Tradable) or restricted.
- Structural Bias (BOS): Shows the dominant structural direction (Long, Short, or Neutral) associated with each emulated timeframe.
- AVWAP Alignment: Highlights whether current price location is aligned (Long / Short) or neutral relative to active chart Worldlines.
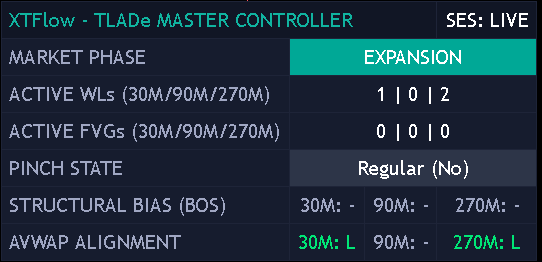
Fig. 7.1 - Master Controller Widget
5-Minute Chart (Recommended)
XTFlow - TLADe Worldline is engineered and calibrated specifically to operate on 5-minute charts. This timeframe represents the ideal statistical sweet spot to filter micro-structure noise while preserving entry responsiveness.
Zero Timeframe Switching
The algorithm automatically projects and calculates relevant levels from higher timeframes directly onto your 5m execution chart. No secondary windows or interval switching required: the entire multi-timeframe map is synthesized in real time on a single view.
Cross-Asset Universality
Volume profiling, AVWAP, and Break of Structure (BOS) mechanics rely on objective liquidity principles: the indicator is applicable across any ticker or financial asset (Futures, Indices, Equities, Forex, Crypto, Commodities).
TECHNICAL SUMMARY AND STRATEGIC VALUE
XTFlow - TLADe Worldline condenses an integrated suite of quantitative metrics into a single execution window. The simultaneous combination of multi-timeframe structure, volume distribution, and AVWAP price anchors provides traders with objective high-probability reference levels, isolating true price reaction zones and defining trend direction without ambiguity.
By reducing market complexity into coordinated signals on a single execution chart, the suite eliminates analytical fragmentation and delivers a rigorous operational framework grounded in actual volume dynamics and structural liquidity.