
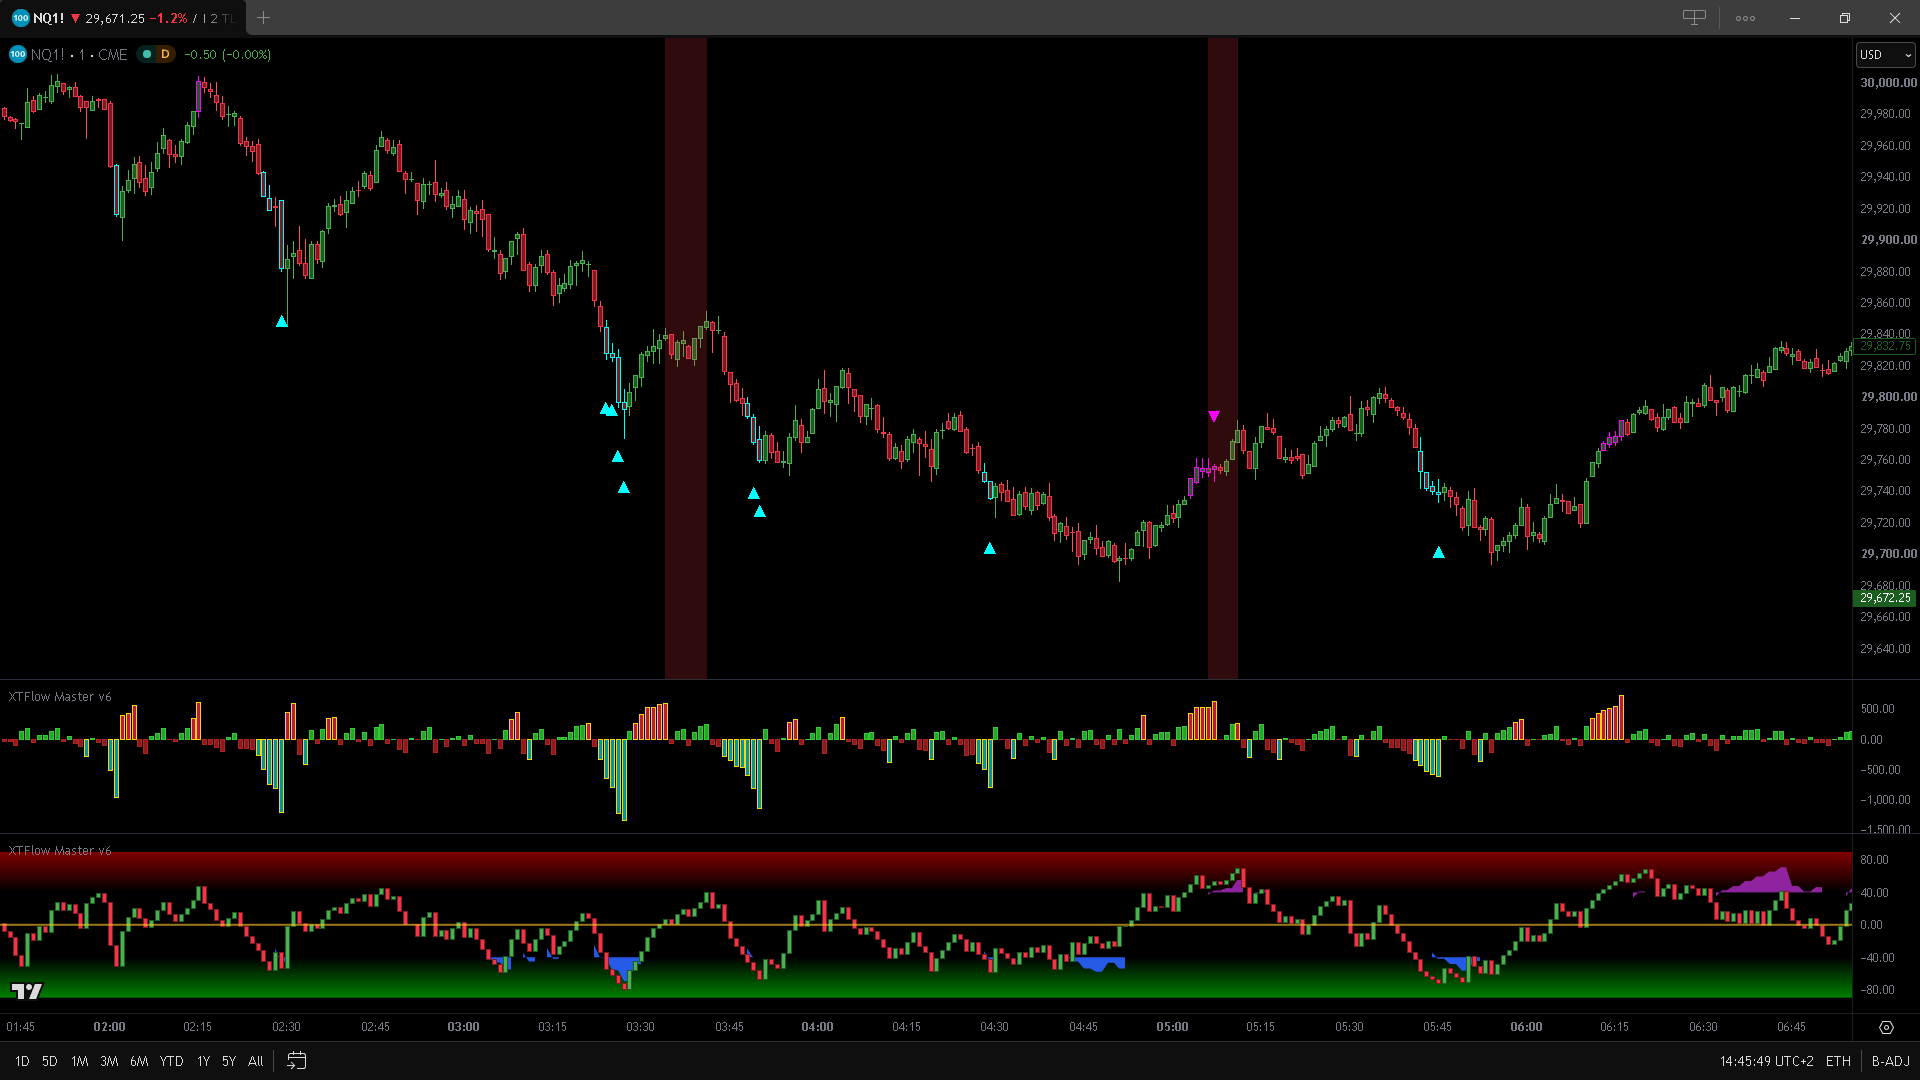
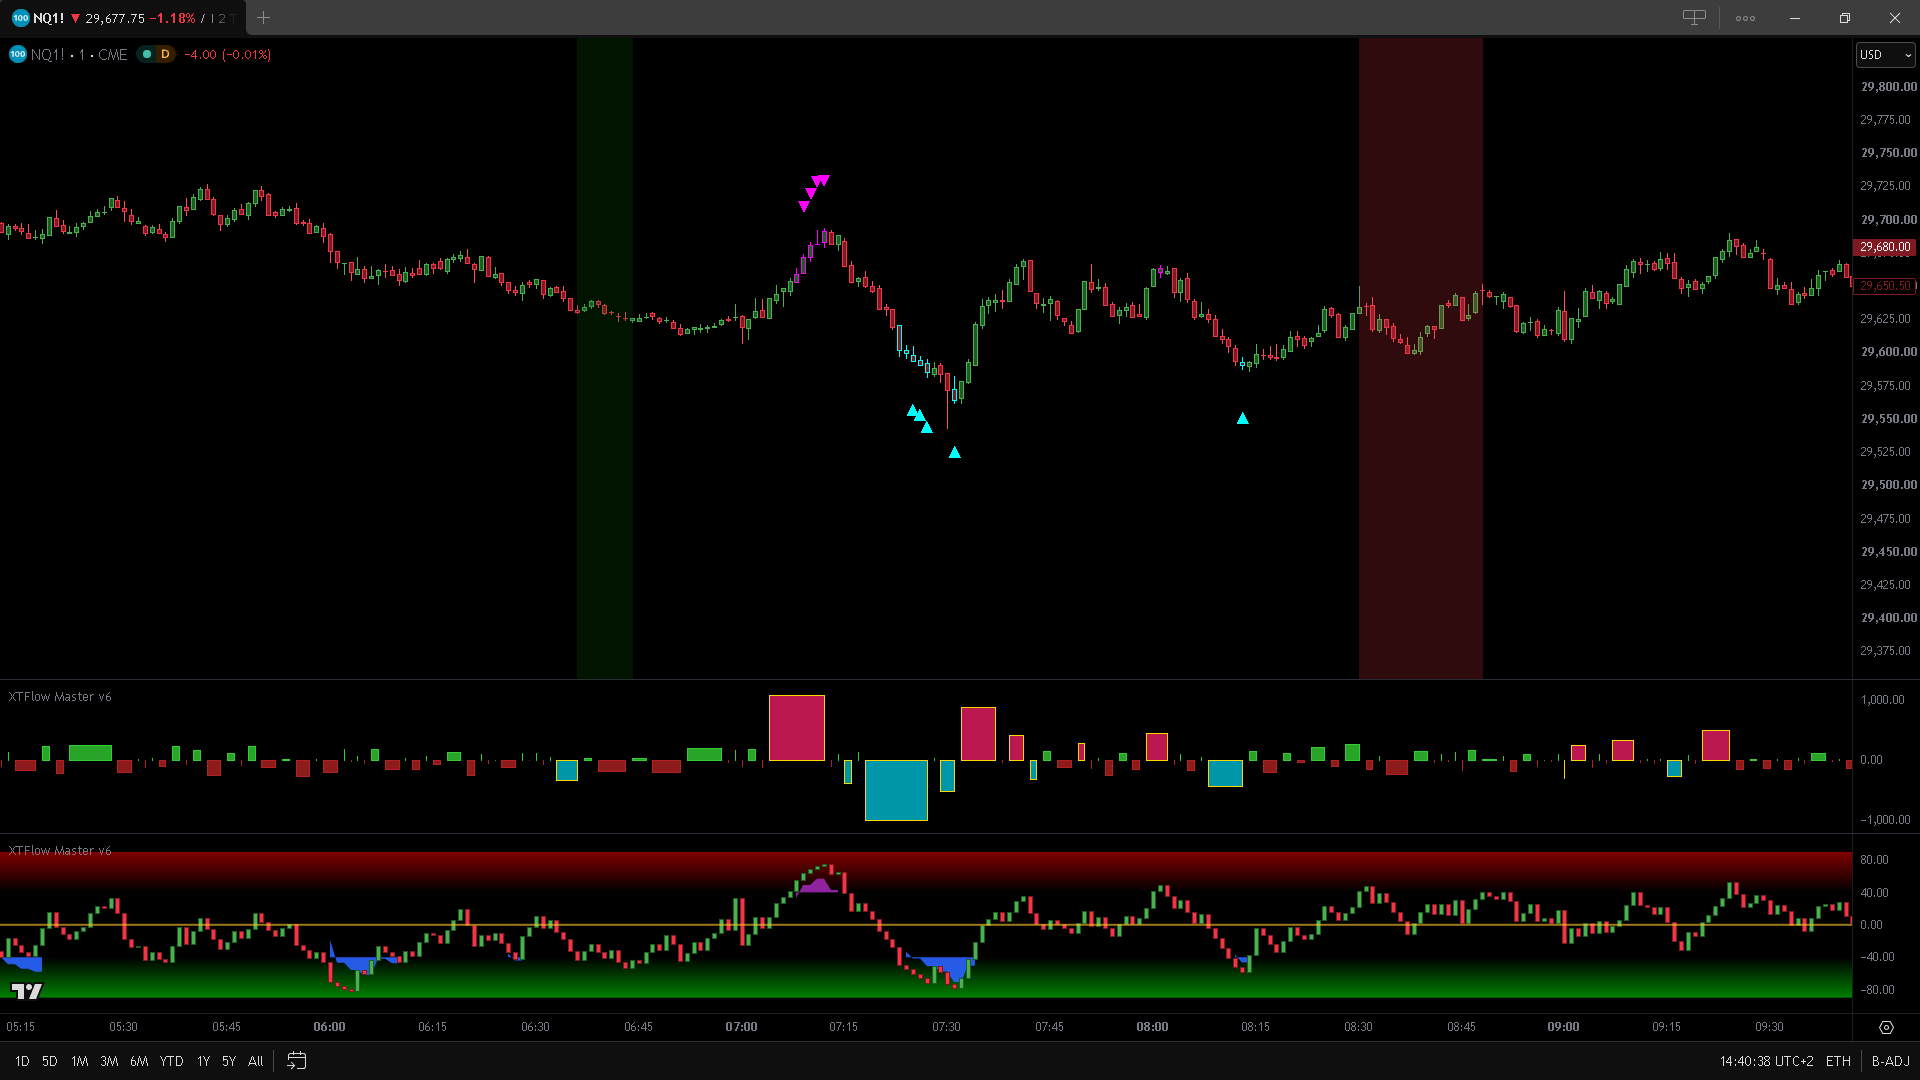
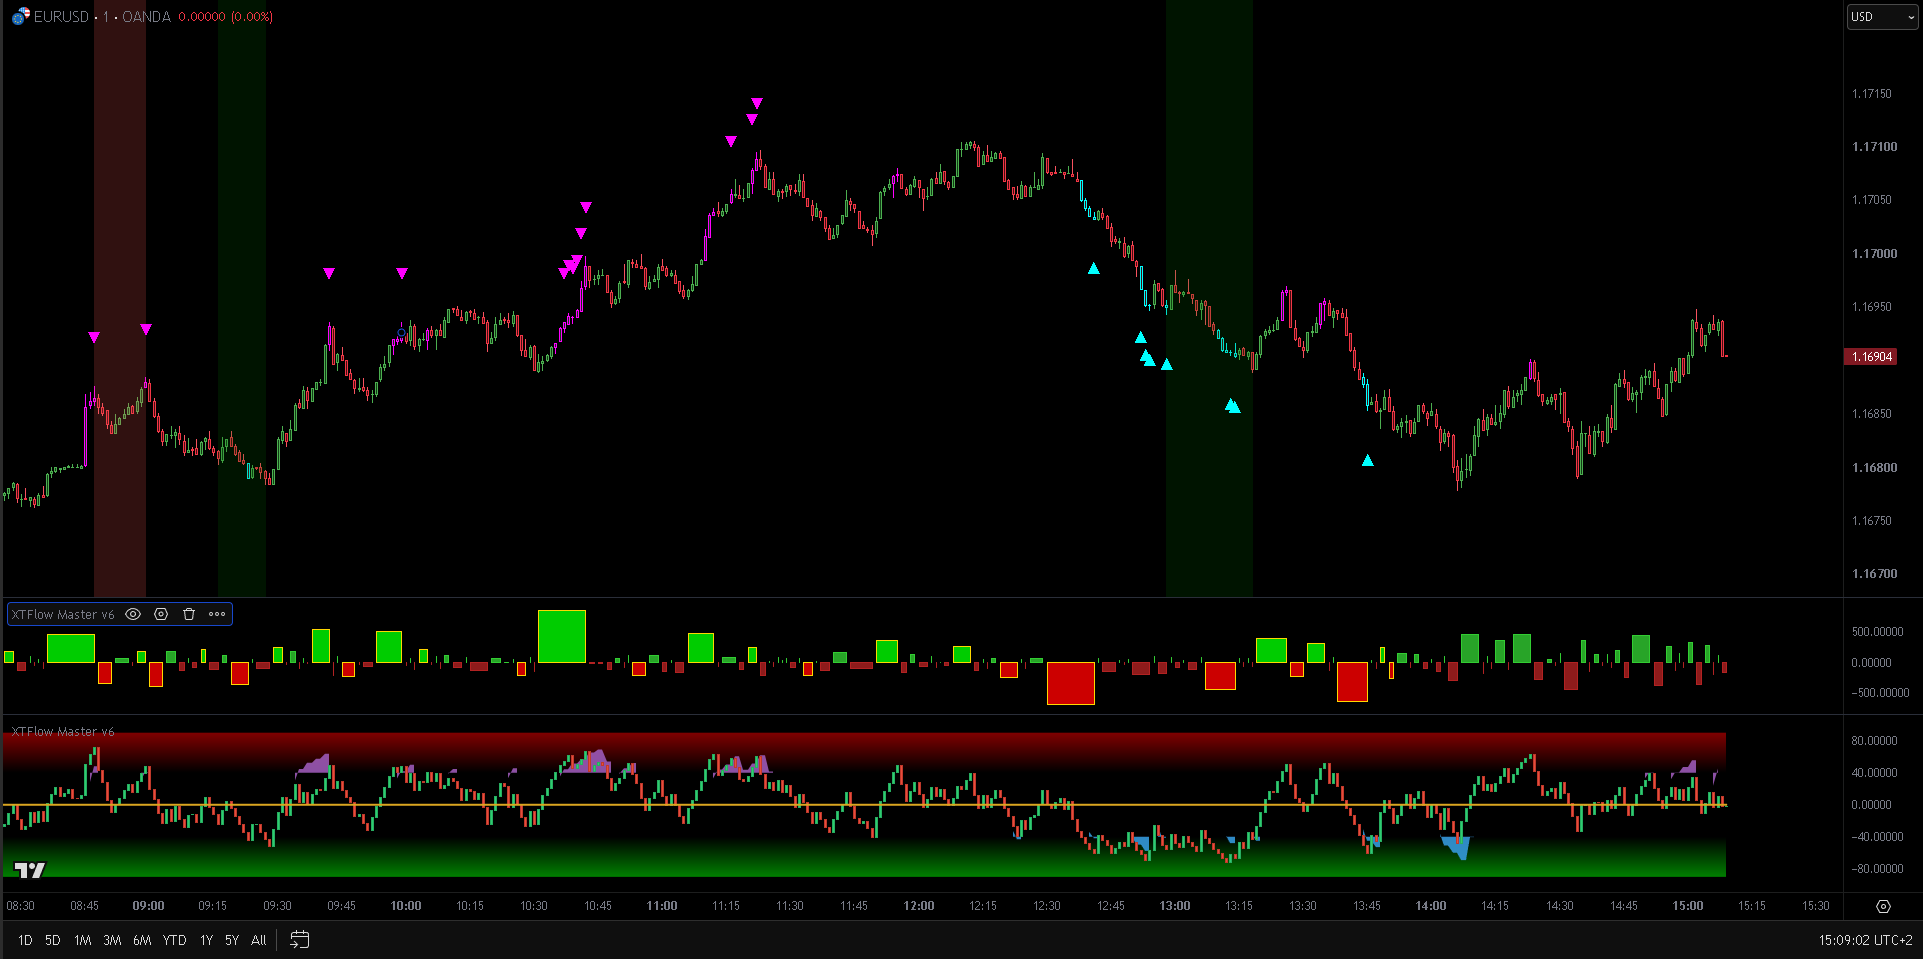
The delta blocks, volume oscillators, and confluence signals displayed in this technical report represent hypothetical and simulated analytical models for educational purposes.
DUAL-INSTANCE DEPLOYMENT ARCHITECTURE
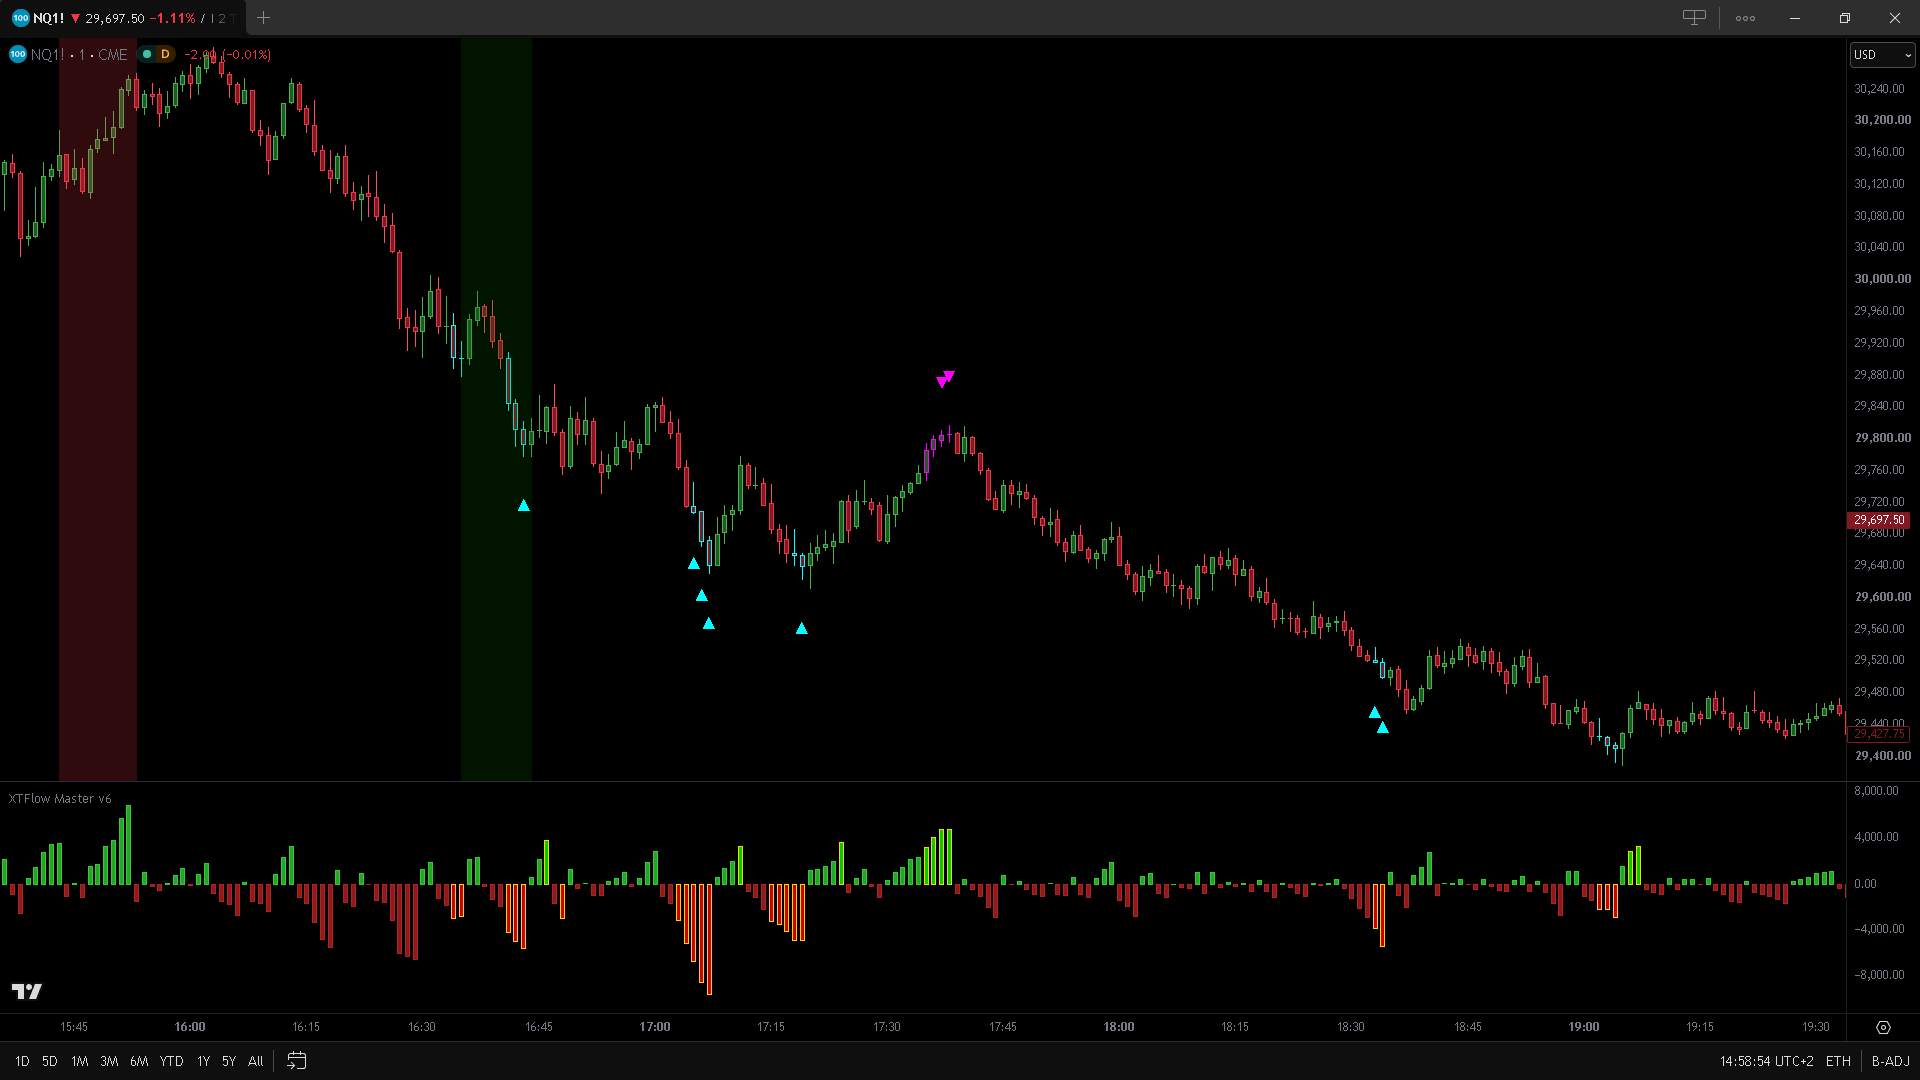
The XTFlow Master v6 engine is architected for dual-instance execution. To maximize analytical resolution while preserving visual clarity, the system partitions its analytical pipeline across two synchronized operational layers:
- • Lower Panel (V2 Oscillator): Positioned below the main price pane, configured exclusively to analyze and isolate multi-timeframe volume flow and momentum progression.
- • Upper Panel (D1 Delta Blocks & Price Overlay): Applied directly onto the main price pane, configured to map session-adaptive cumulative delta blocks, detect volumetric excess anomalies, and project real-time confluence signals across price action.
1. V2 - DUAL-TIMEFRAME VOLUME OSCILLATOR
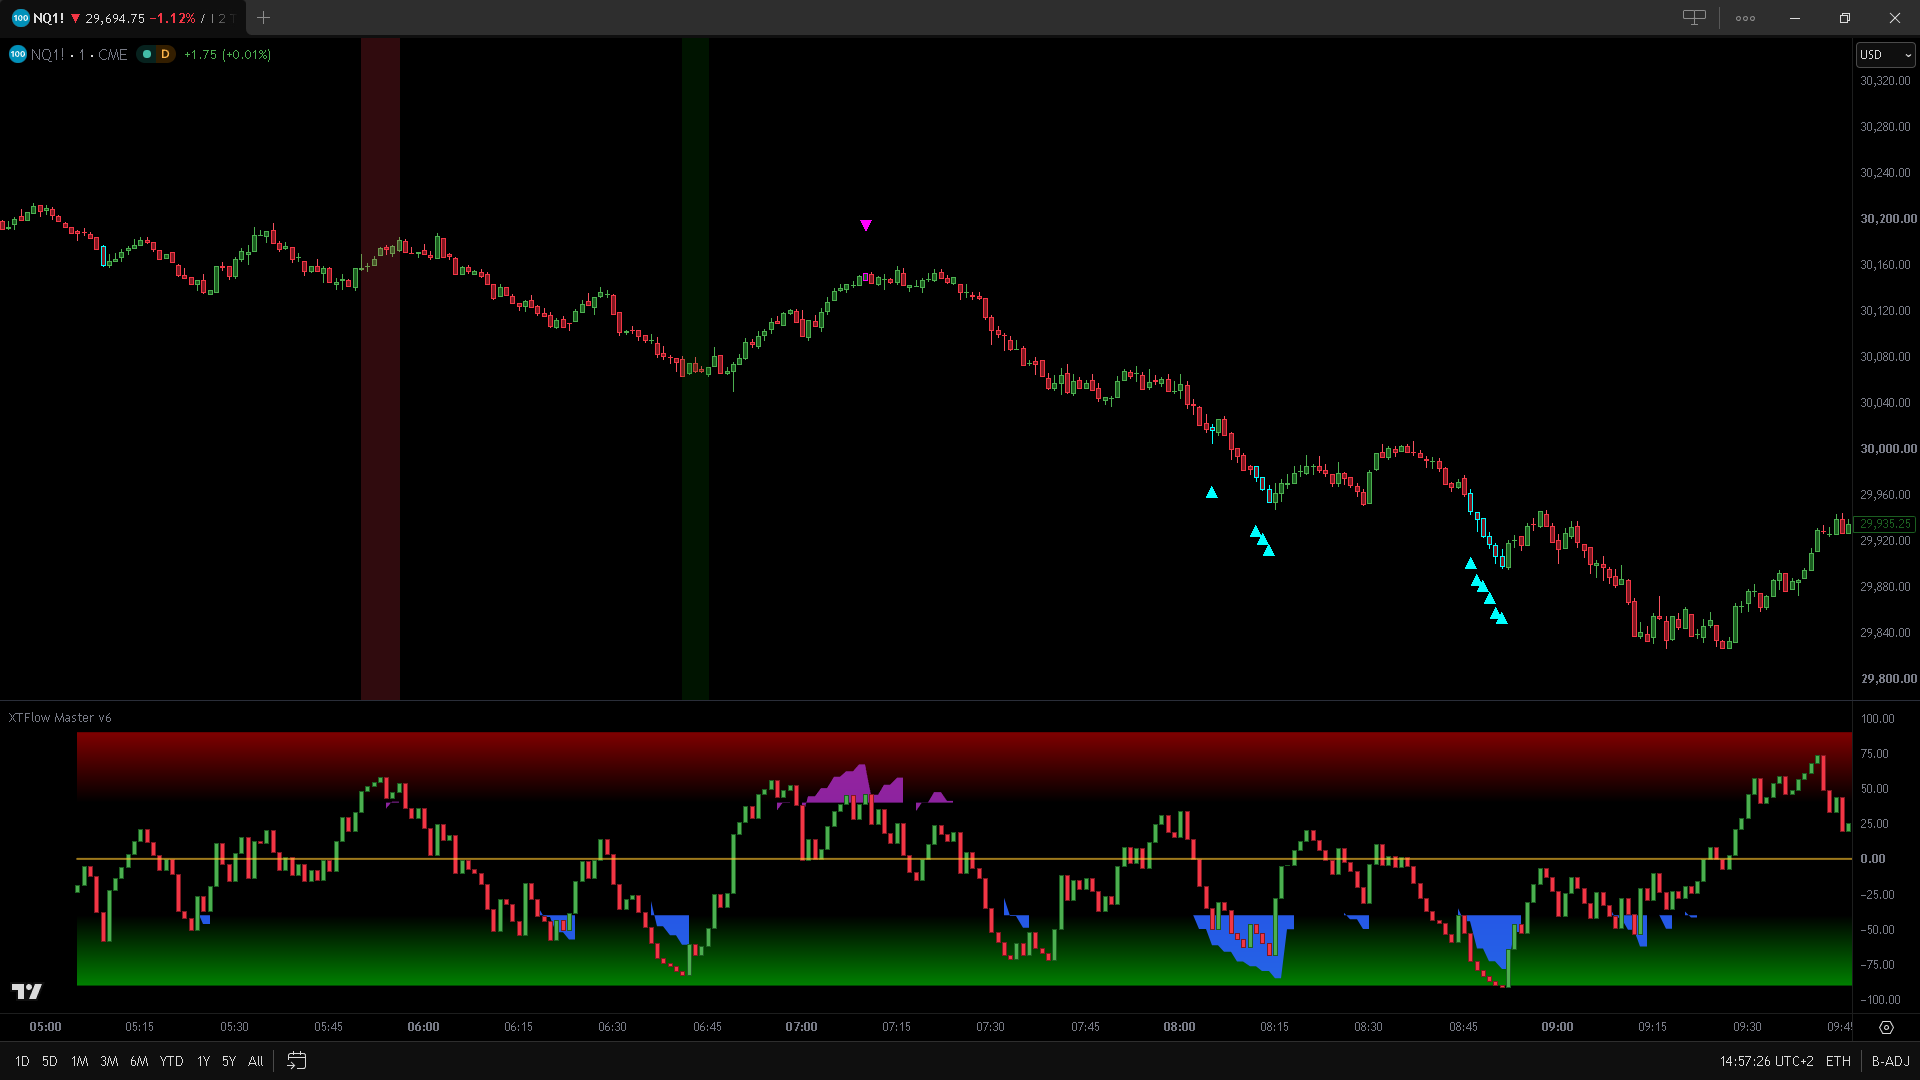
This component isolates the volume-driven momentum vector, operating concurrently across two distinct time horizons to quantify directional impulse. It projects a dynamic oscillator utilizing proprietary volumetric candles. By cross-referencing execution timeframe flow against a higher-level reference timeframe (TF2), the module highlights high-conviction phases where multi-timeframe volume vectors align.
- TF2 Bars Period: Higher timeframe selection for multi-horizon flow synchronization.
- Gradient Banding: Color-coded native gradient background bands to visually identify volume expansion zones.
- XTFlow TF2 Area: High-visibility dynamic area fill rendered when flow intensity crosses predefined analytical thresholds.
2. D1 - SESSION-ADAPTIVE DELTA BLOCKS
This module aggregates cumulative directional delta into discrete logical blocks that shift state only when a measurable change in market pressure occurs. An internal analytical engine processes historical data across recent daily sessions (adjustable lookback period) to establish a dynamic volume benchmark. Consequently, the indicator adapts its threshold sensitivity to the specific time of day, isolating genuine volumetric anomalies where delta exceeds historical norms (Excess phases).
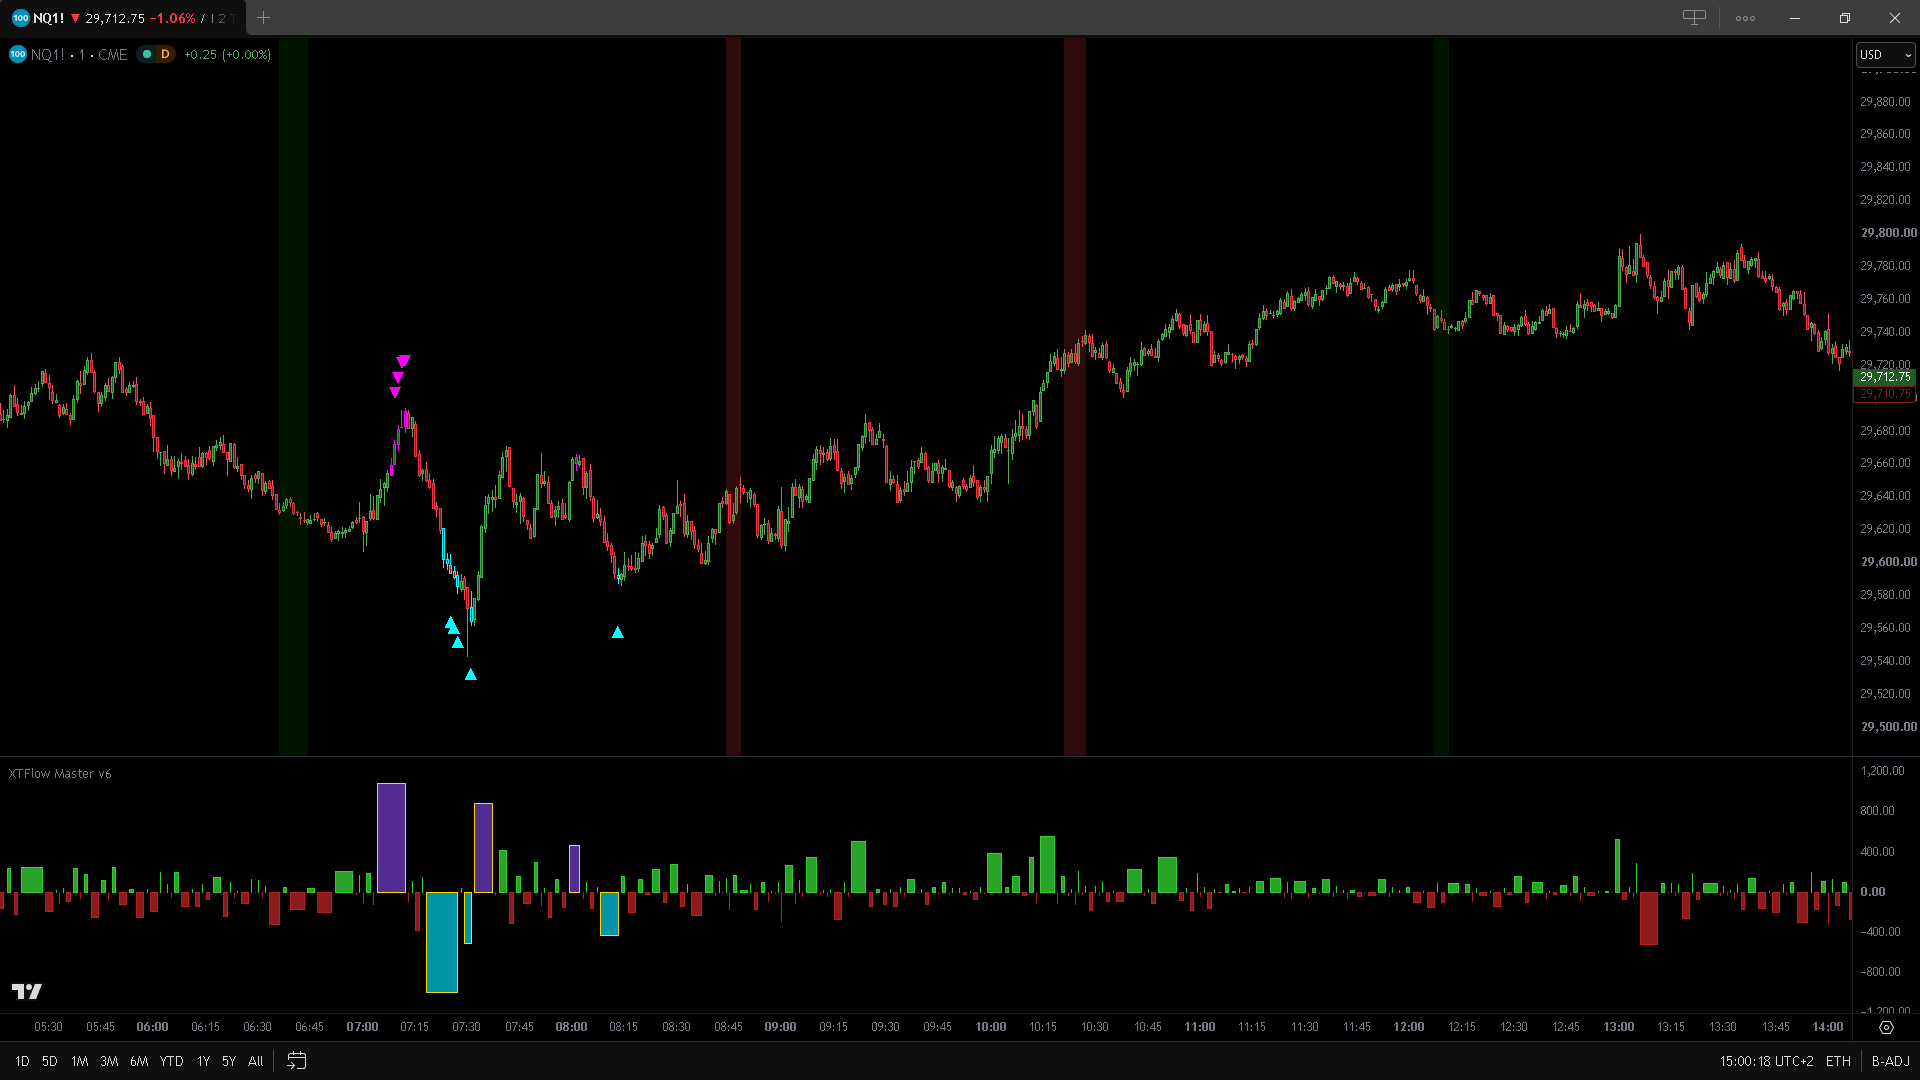
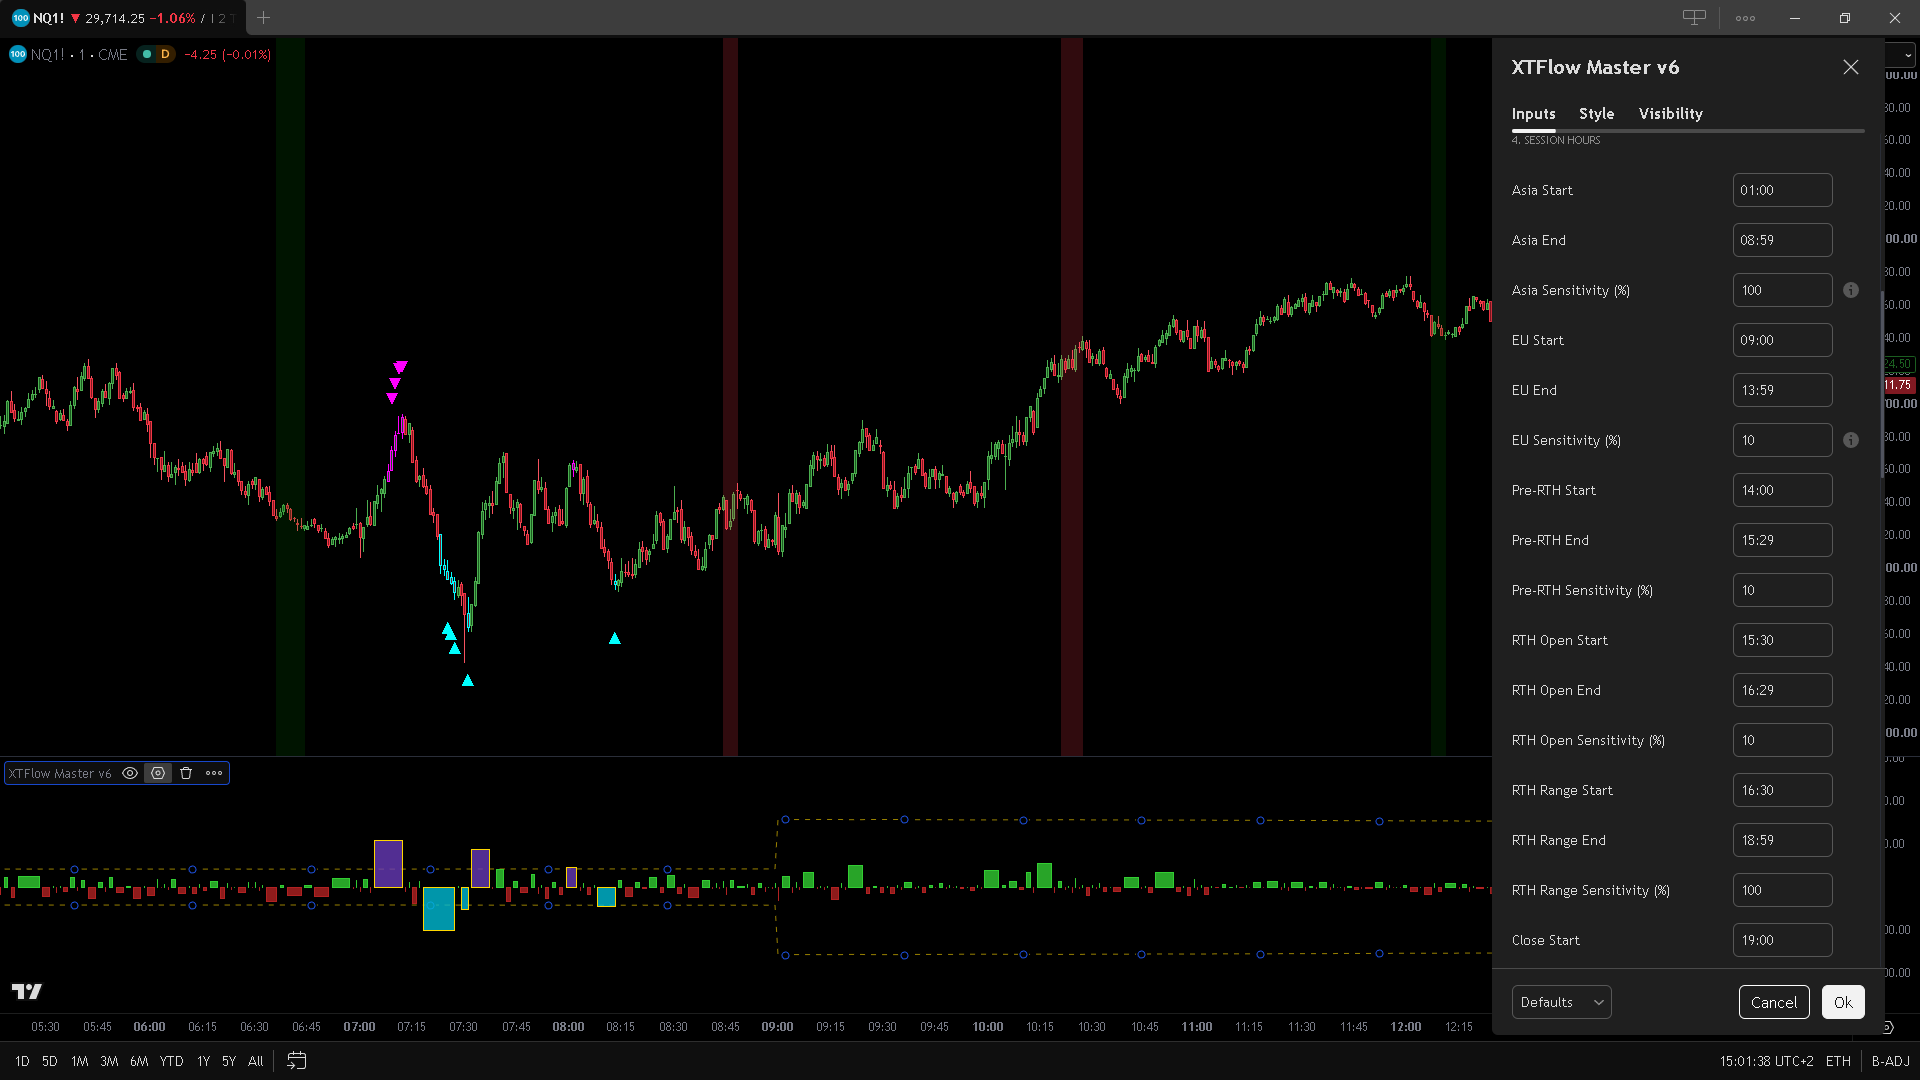
Through the settings panel, users can define precise operating hours for major global financial sessions. The Sensitivity (%) parameter establishes a threshold tolerance over background noise: by calibrating lower values during low-liquidity sessions, the engine calculates baseline averages while filtering minor anomalies, adapting dynamically to historical market volume.
THE PATTERN AND CONFLUENCE ENGINE
- Function: Highlights key convergence moments across proprietary metrics directly on the main chart. Upon multi-metric alignment, the software dynamically recolors the actual price candle borders.
- Operational Application: Allows instant identification of strategic activation zones directly on price action, maintaining a clean, uncluttered execution workspace.
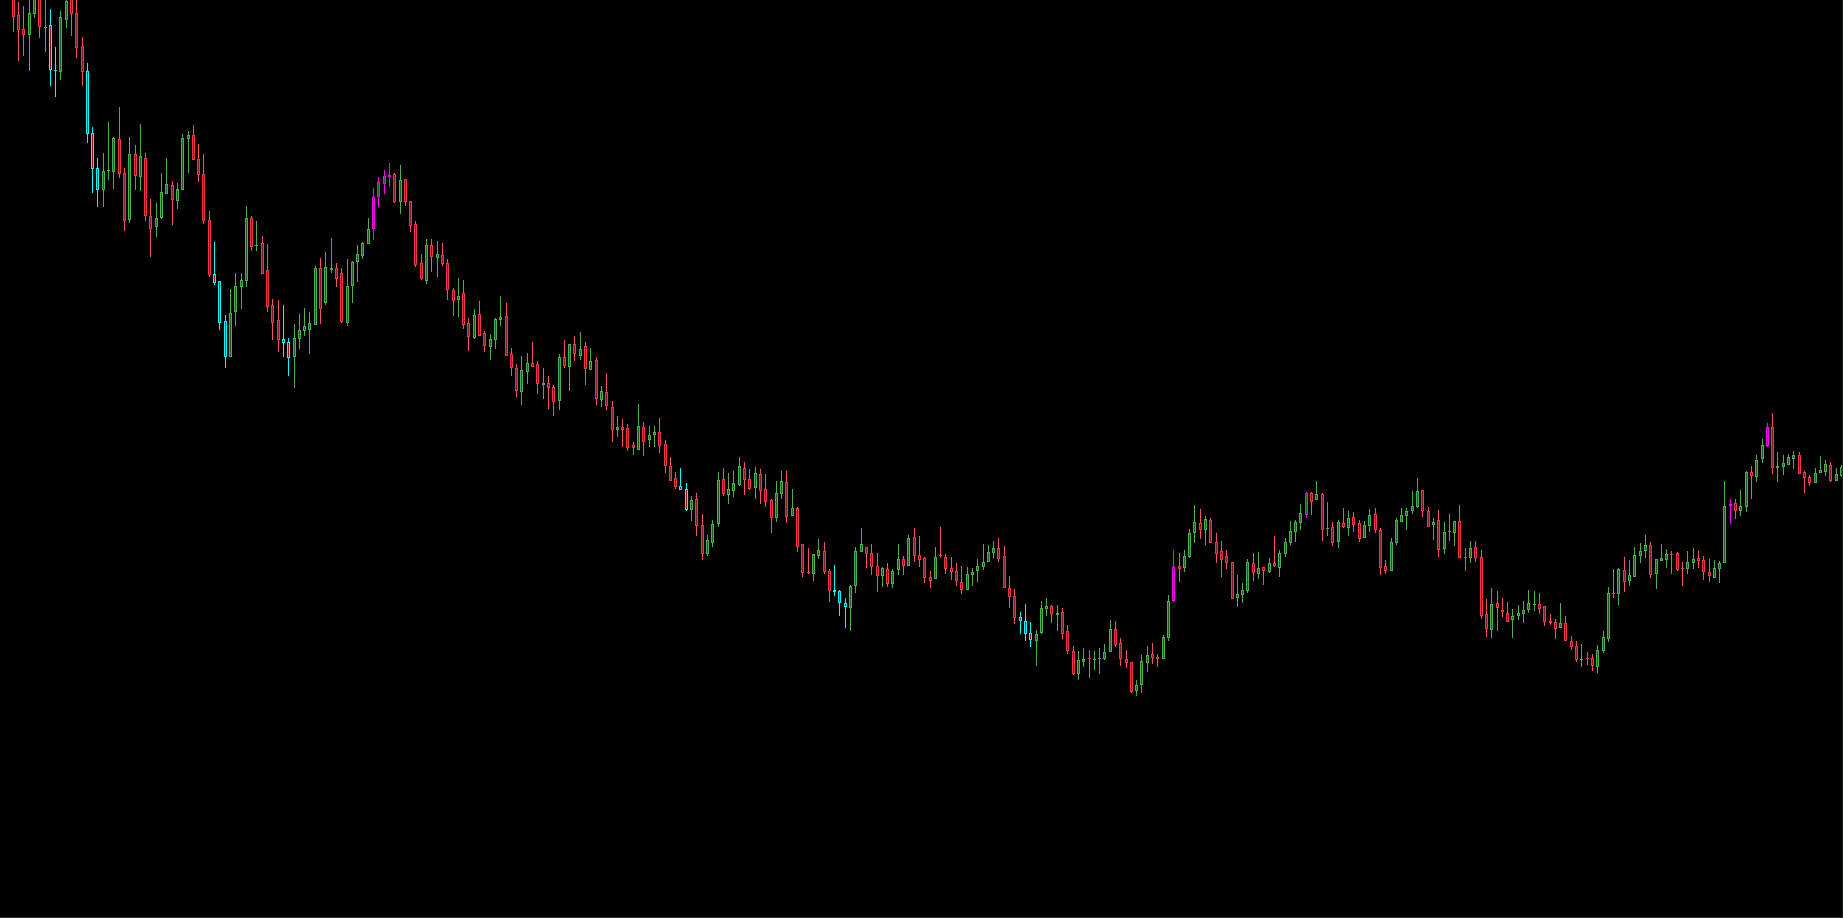
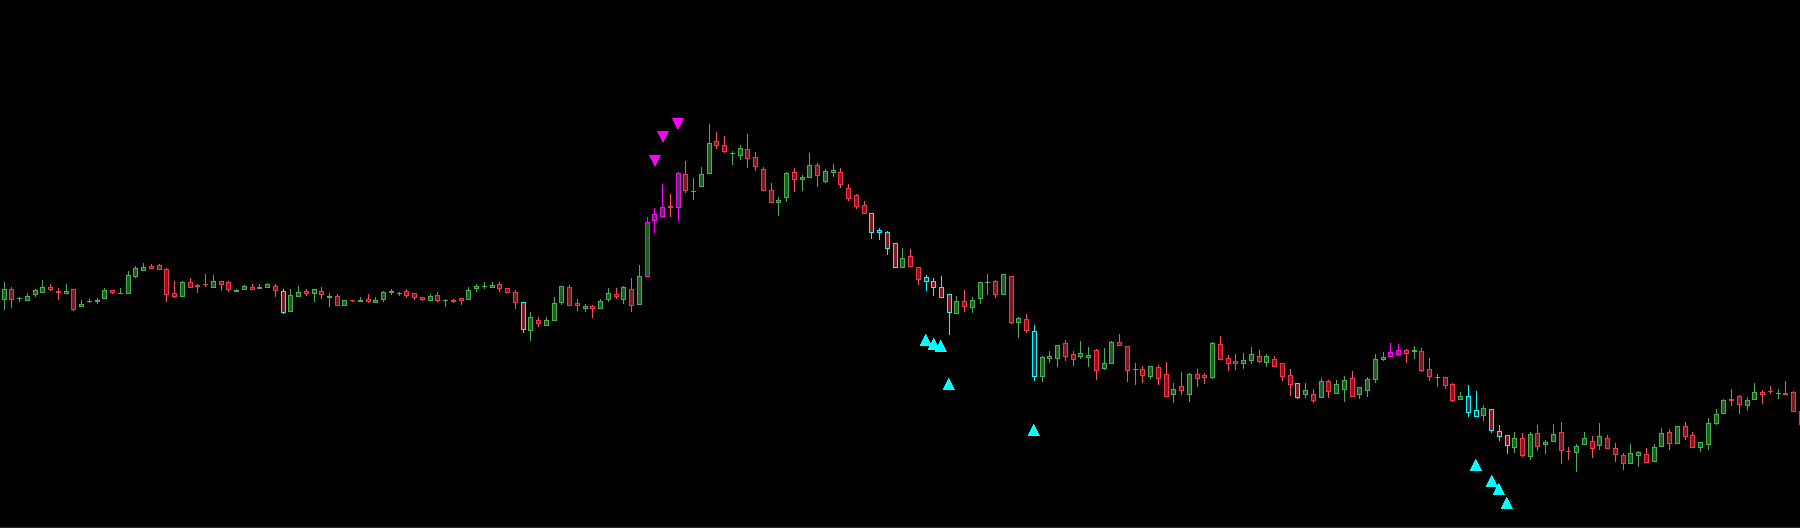
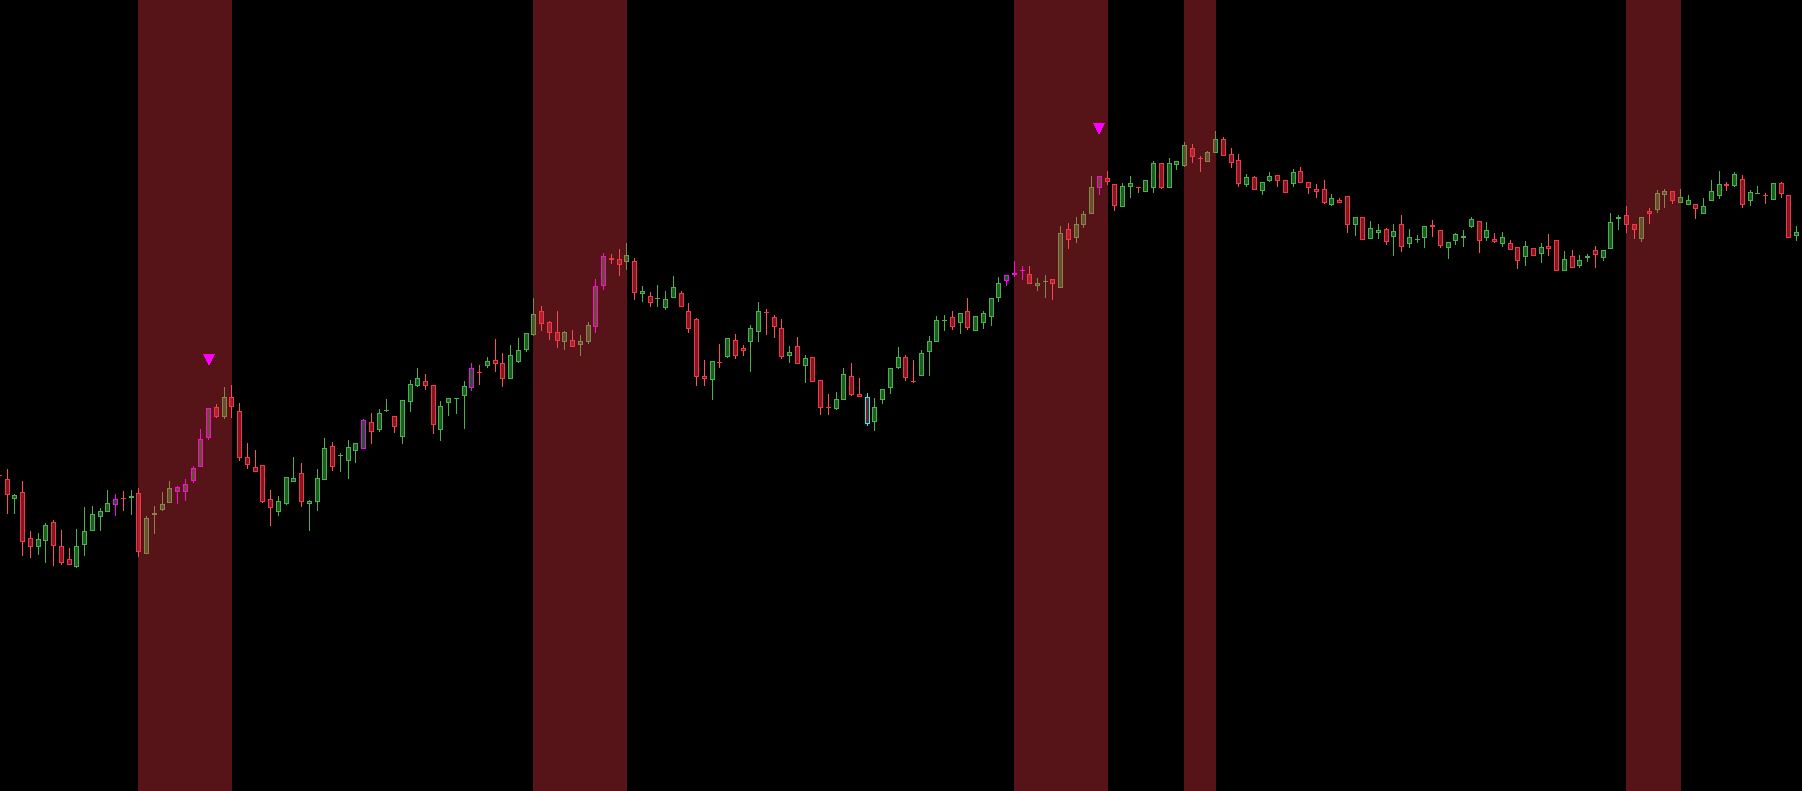
PATTERN SYNERGY (COMBINED INSTANCES IN ACTION)
When all three pattern engines operate simultaneously on the price chart, the trader's workflow receives multi-layered analytical support. The convergence of these three engines visually confirms transitions from strong trending environments to momentum exhaustion and structural re-test zones, maximizing precision in identifying key reversal levels.
USER PROFILING AND CONFIGURABILITY
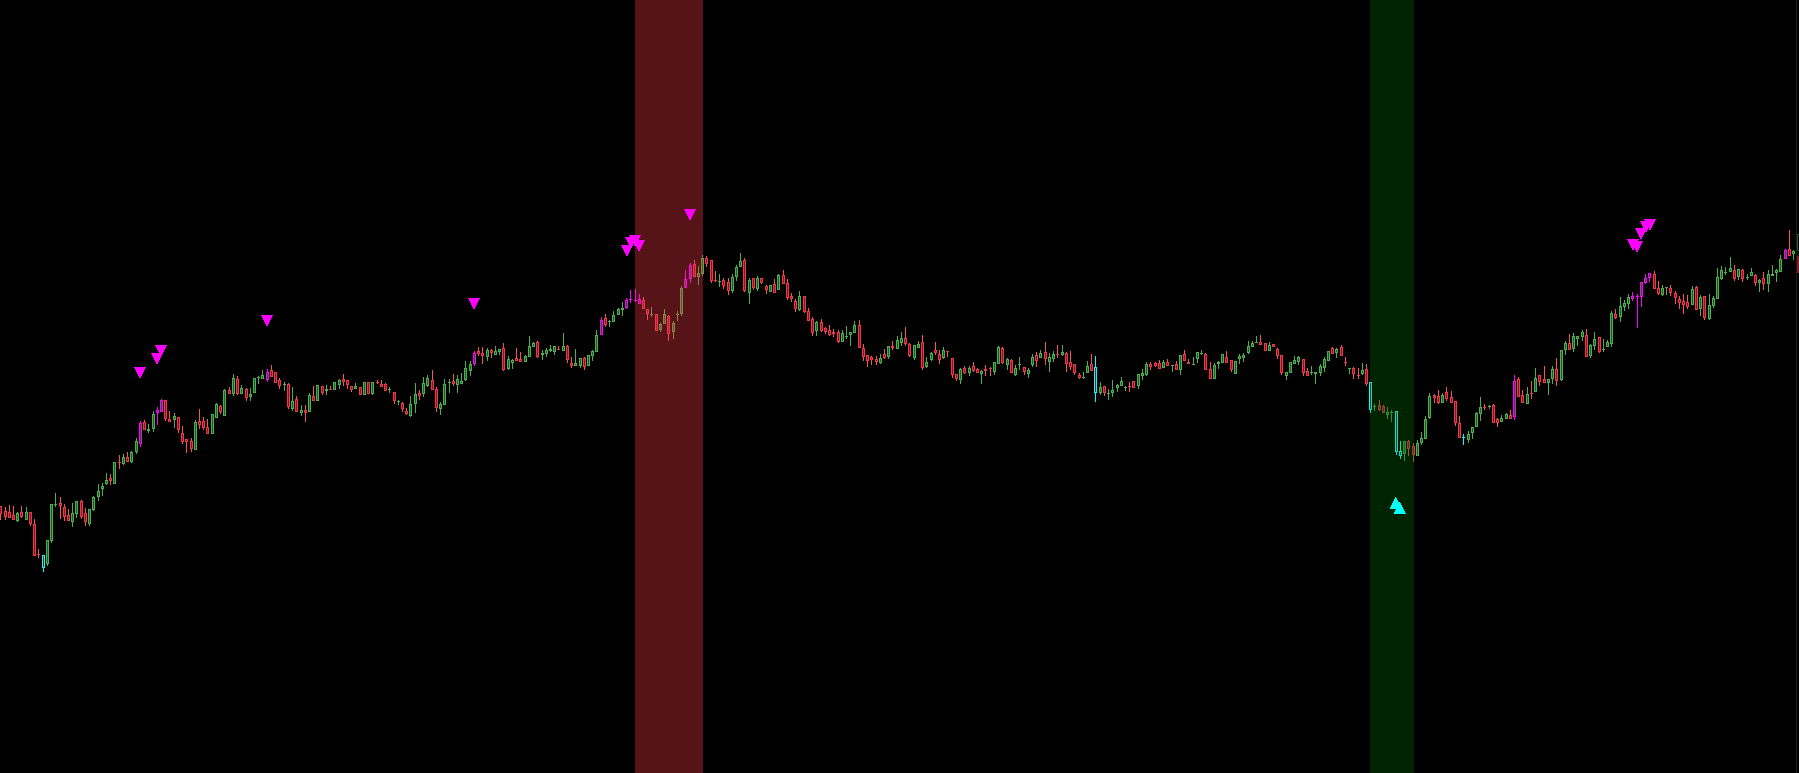
Provides an immediate visual experience. Observing the appearance of extreme confluence arrows on price (Pattern 2) or candle border color shifts (Pattern 1) allows swift identification of potential trend reversal contexts or momentum exhaustion.
The parameter panel allows detailed calibration of the engine. Users can map operating sessions to preferred global market time zones, filter background noise by adjusting percentage sensitivity for delta blocks during low-liquidity hours, and customize structural divergence criteria (Pattern 3) by tuning tick tolerance and swing strength to match specific asset dynamics.
METHODOLOGICAL EXECUTION NOTES
The architecture of XTFlow Master v6 provides a rigorous quantitative decoding of market movement health. The combined action of the three pattern engines (candle border color shifts, extreme signal arrows, and divergence bands) isolates contexts where price action lacks true volumetric support, offering a distinct probabilistic edge in identifying local tops/bottoms and execution timing.
While effective as an independent tool, aligning Master v6 metrics with intrabar zone mapping and institutional pause identification transforms the chart into a complete analytical terminal, maximizing decision-making consistency across any timeframe.