
Intrabar analysis, EventFlow zones, and microstructure scenarios in this report represent hypothetical observations and historical chartings for educational purposes only.
1. SCANNING TECHNOLOGY: INTRABAR & MULTI-CANDLE ANALYSIS
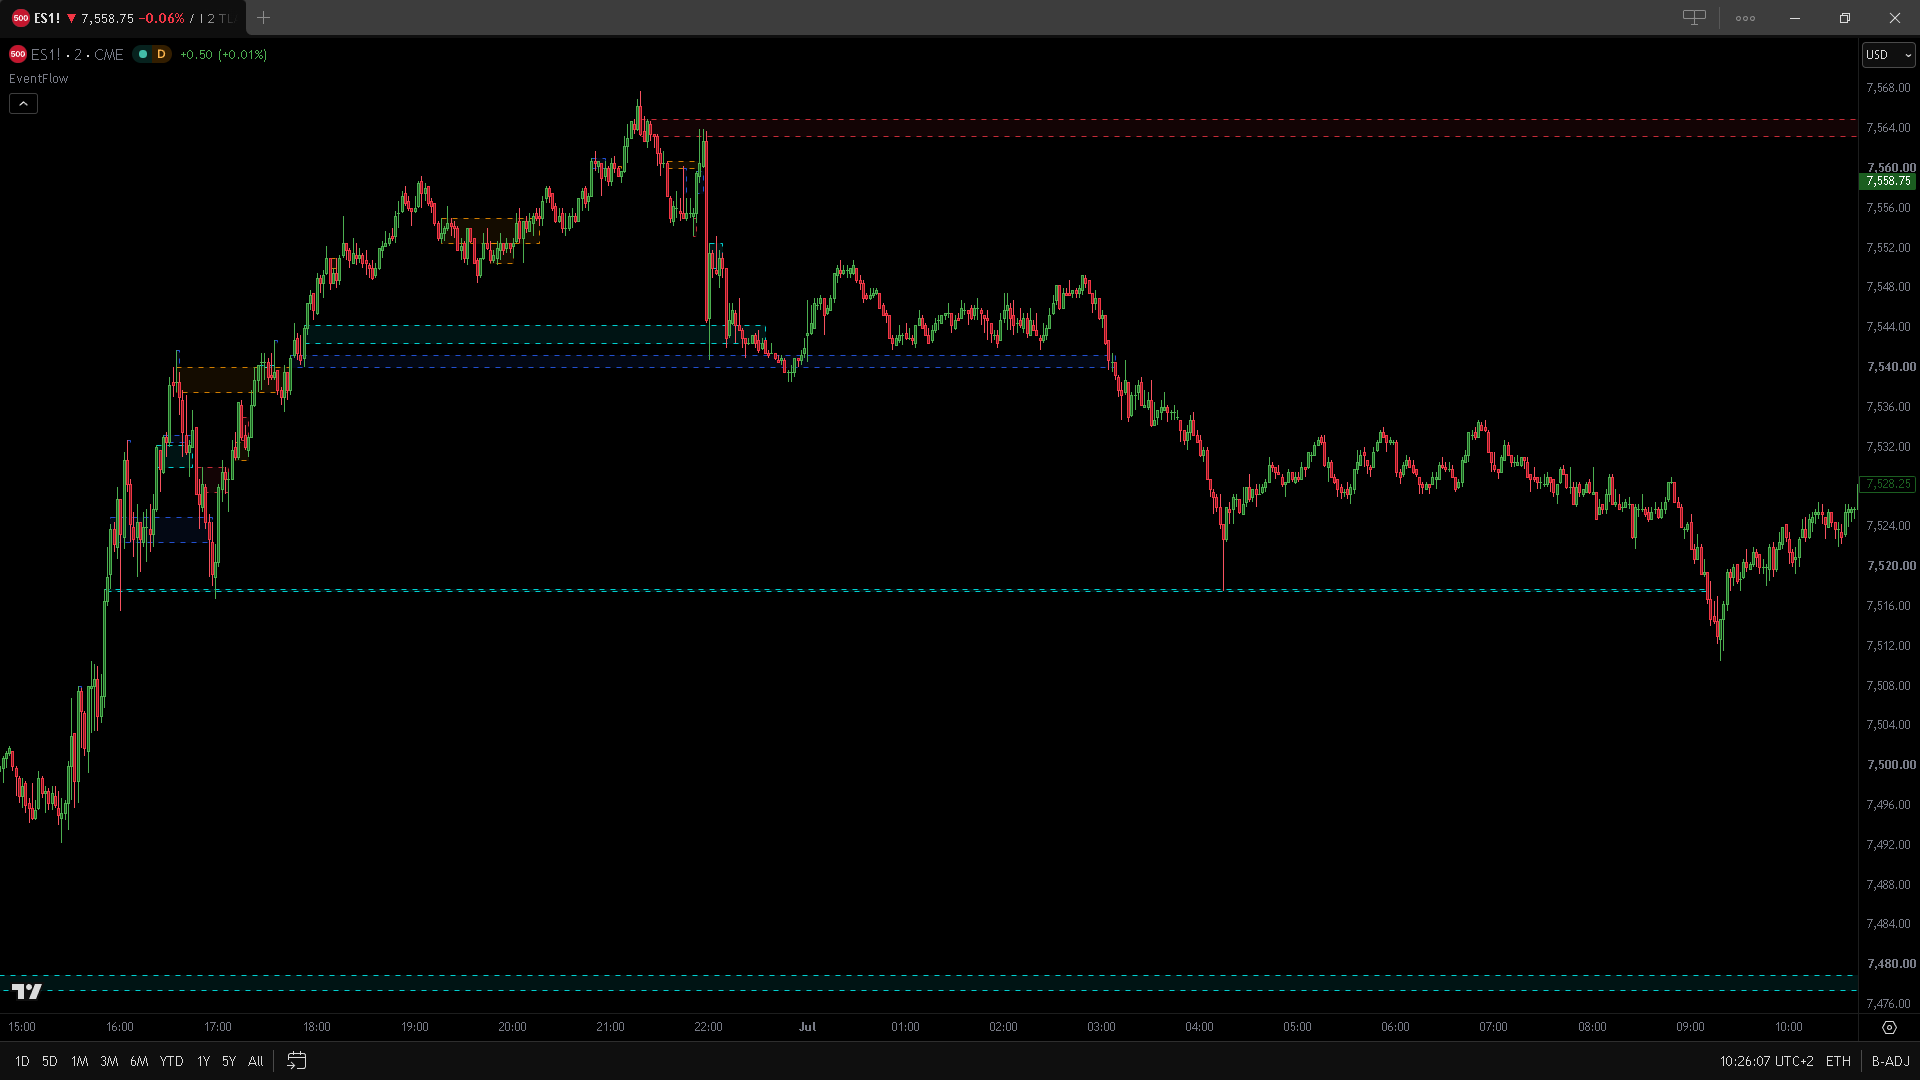
At the core of EventFlow lies a dual-tier calculation engine engineered to verify the true structural consistency of volume flows:
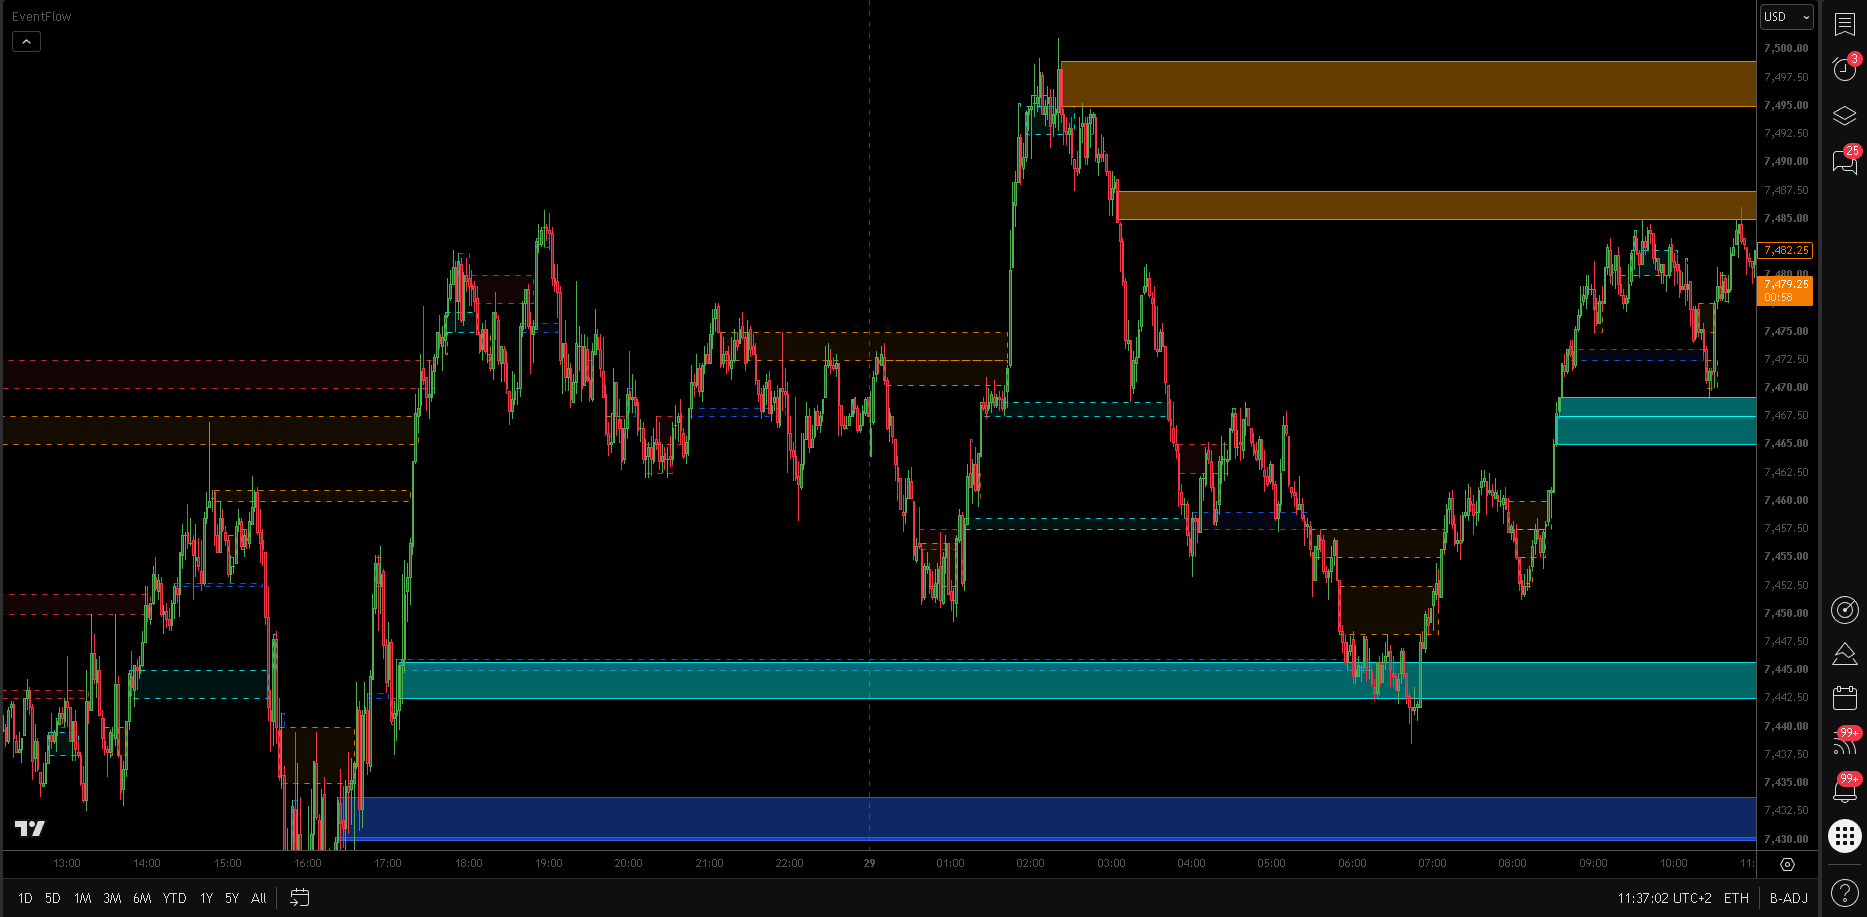
The algorithm performs deep micro-interval analysis within each individual bar. This operation reveals internal order flow distribution that remains completely invisible on standard time-based charts.
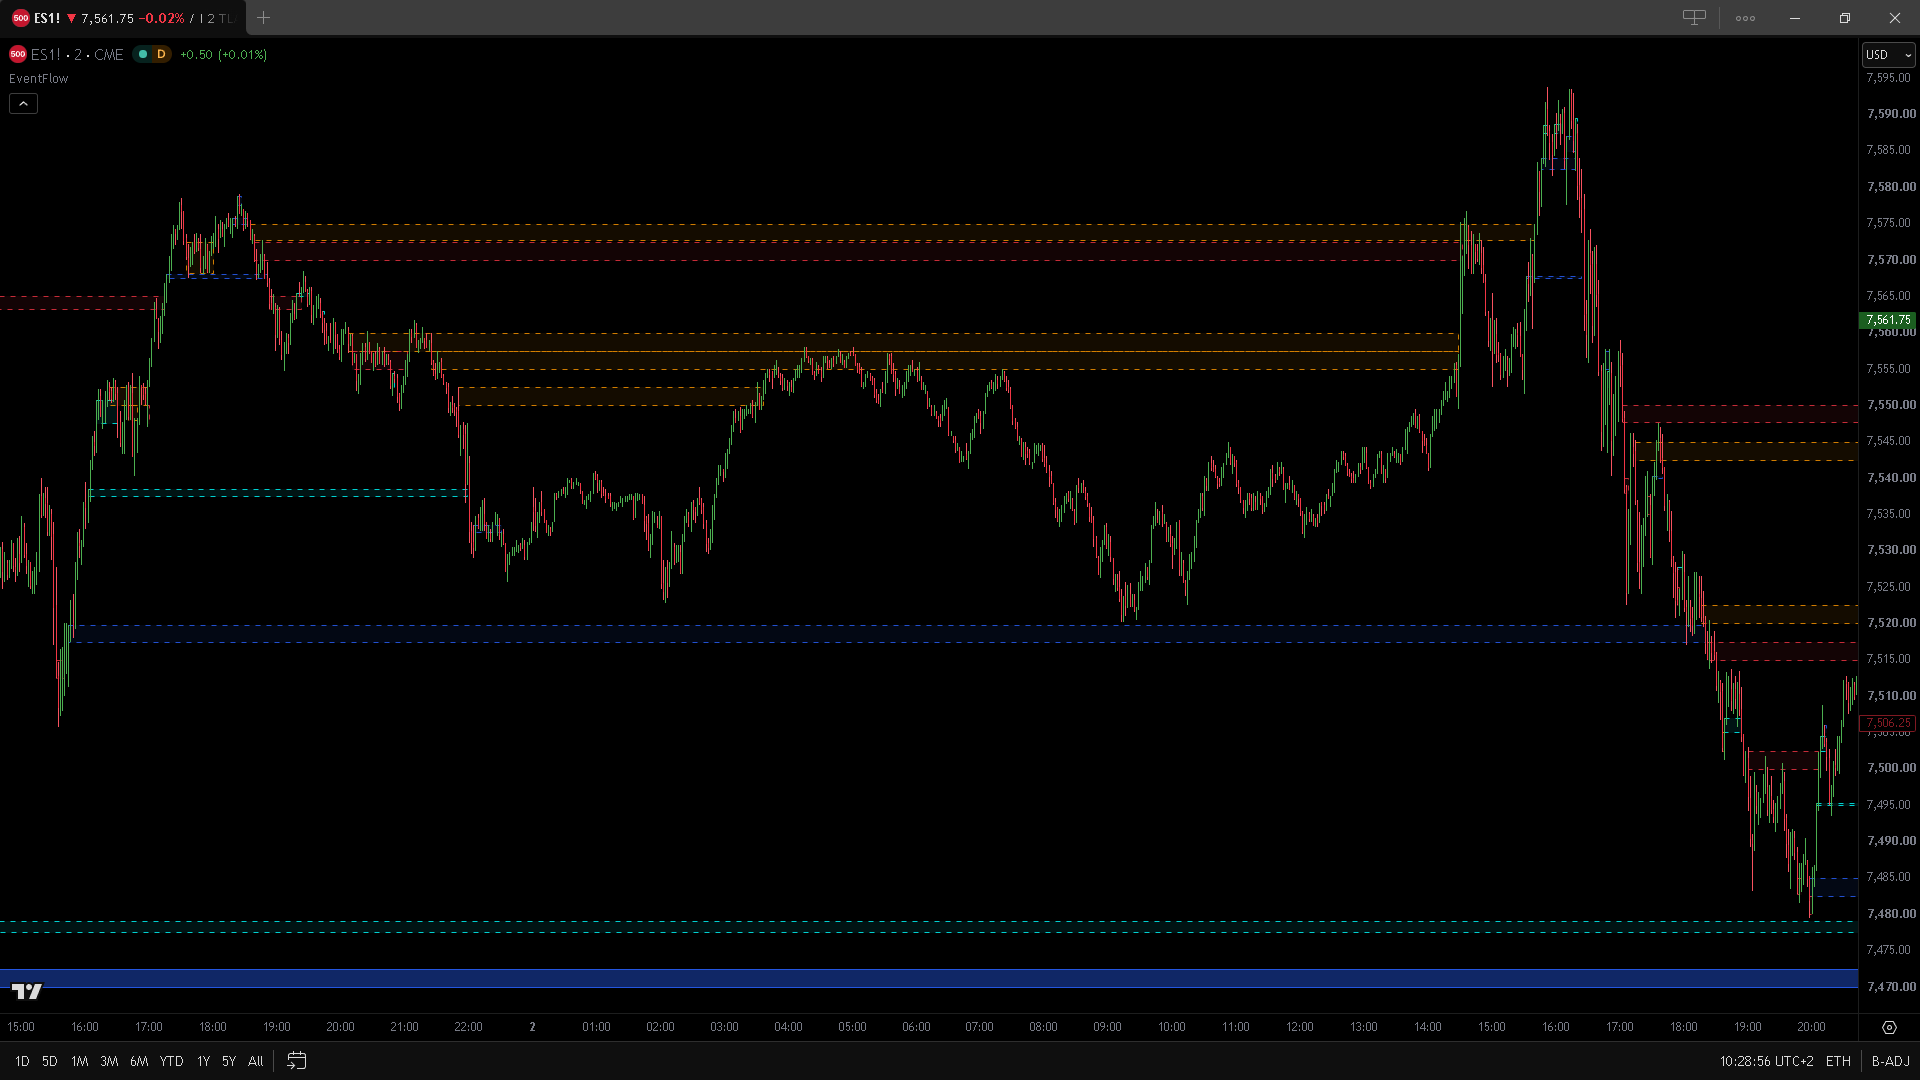
Zone generation is not based on single-bar snapshots alone; the calculation algorithm evaluates order flow metrics backwards across prior multi-candle sequences. This retrospective multi-bar analysis verifies that microstructural pressure persists across consecutive bars before spawning a zone, ensuring only genuine structural levels are plotted.
2. ZONE CLASSIFICATION: STANDARD & STRONG
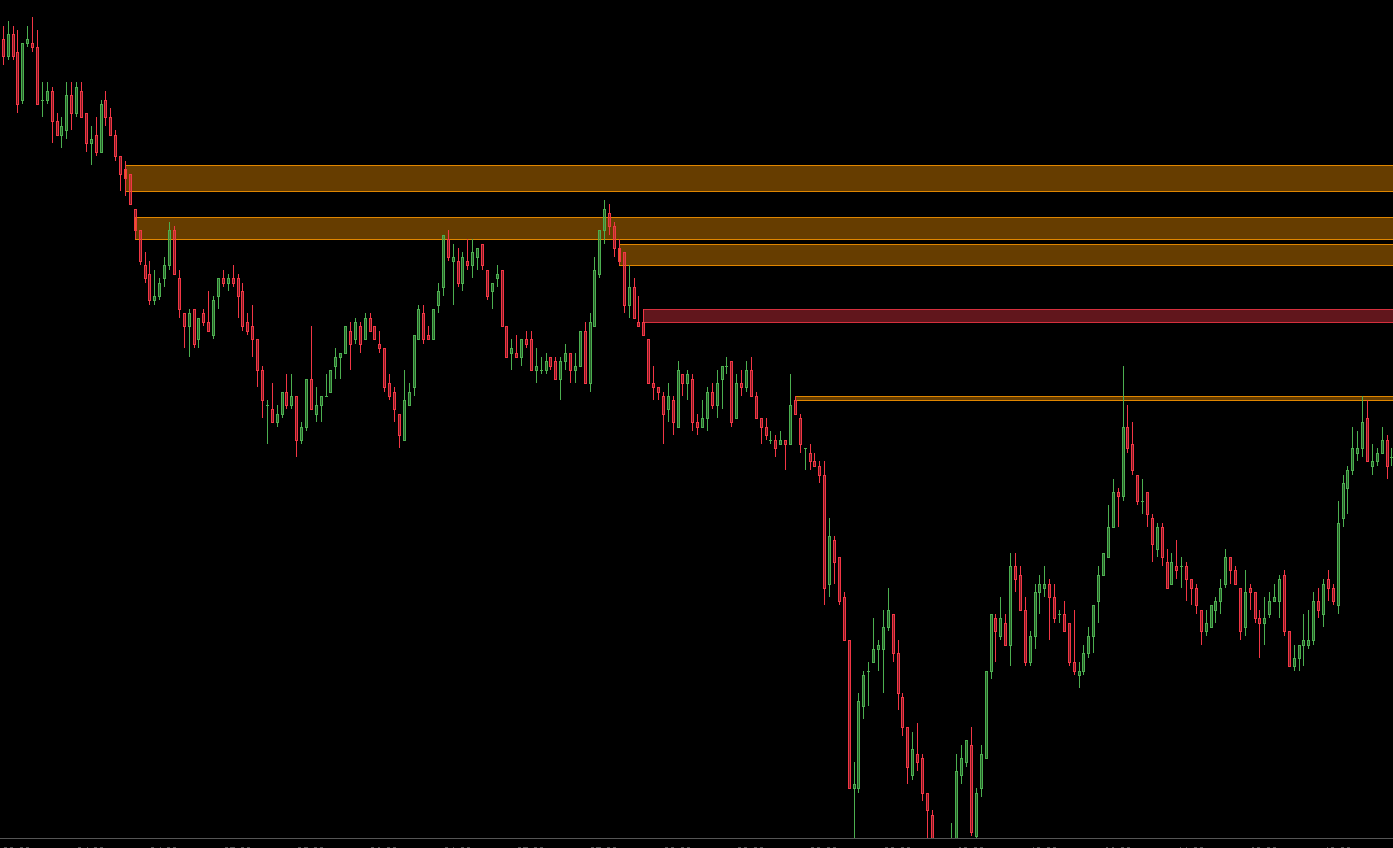
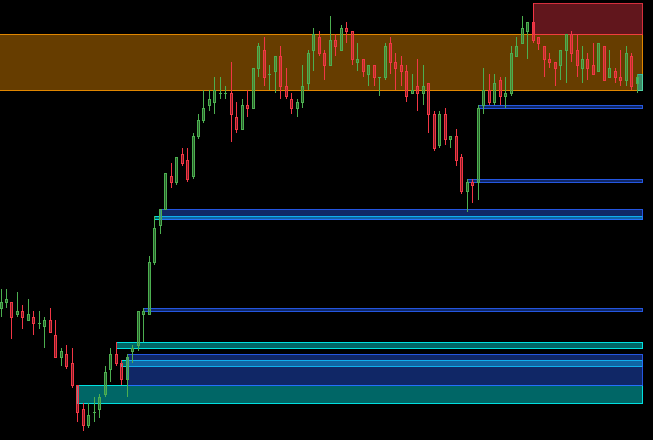
EventFlow classifies detected zone intensity across a two-tier scale, offering traders an immediate operational hierarchy that highlights genuine structural turning points:
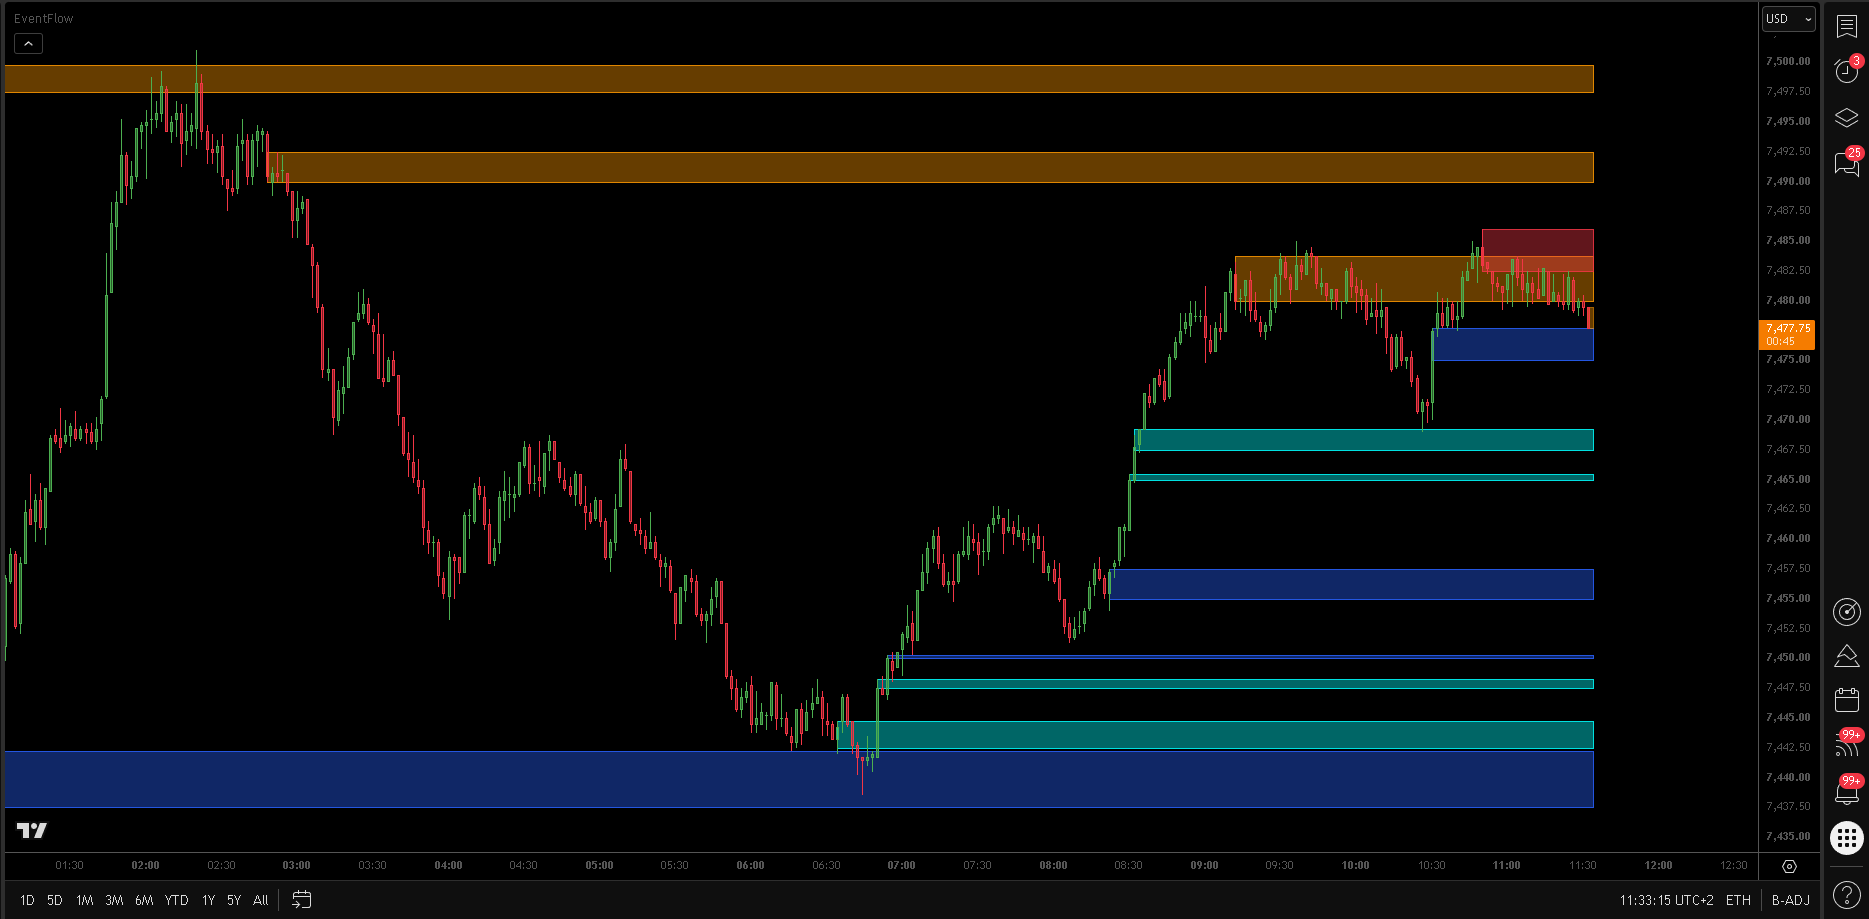
Identify areas where microstructural dynamics have met baseline detection thresholds. They represent standard points of interest where the market exhibited a clear clash between buying and selling forces.
Highlight key levels where the algorithm detects exceptional volume concentration or directional order flow pressure. These zones mark macro structural turning points where one side decisively dominated price action.
3. BEYOND CONVENTIONAL LEVELS: MAPPING MARKET PARTICIPANT INTENTIONS, SUCCESSES, AND FAILURES
EventFlow does not simply draw static support and resistance lines based on legacy price history. Its algorithmic engine identifies and calculates real-time microstructural events that reveal the underlying intentions of institutional market participants.
Every zone visualized on the chart originates as a live footprint of an ongoing initiative. The evolution of these attempts provides two crucial operational insights:
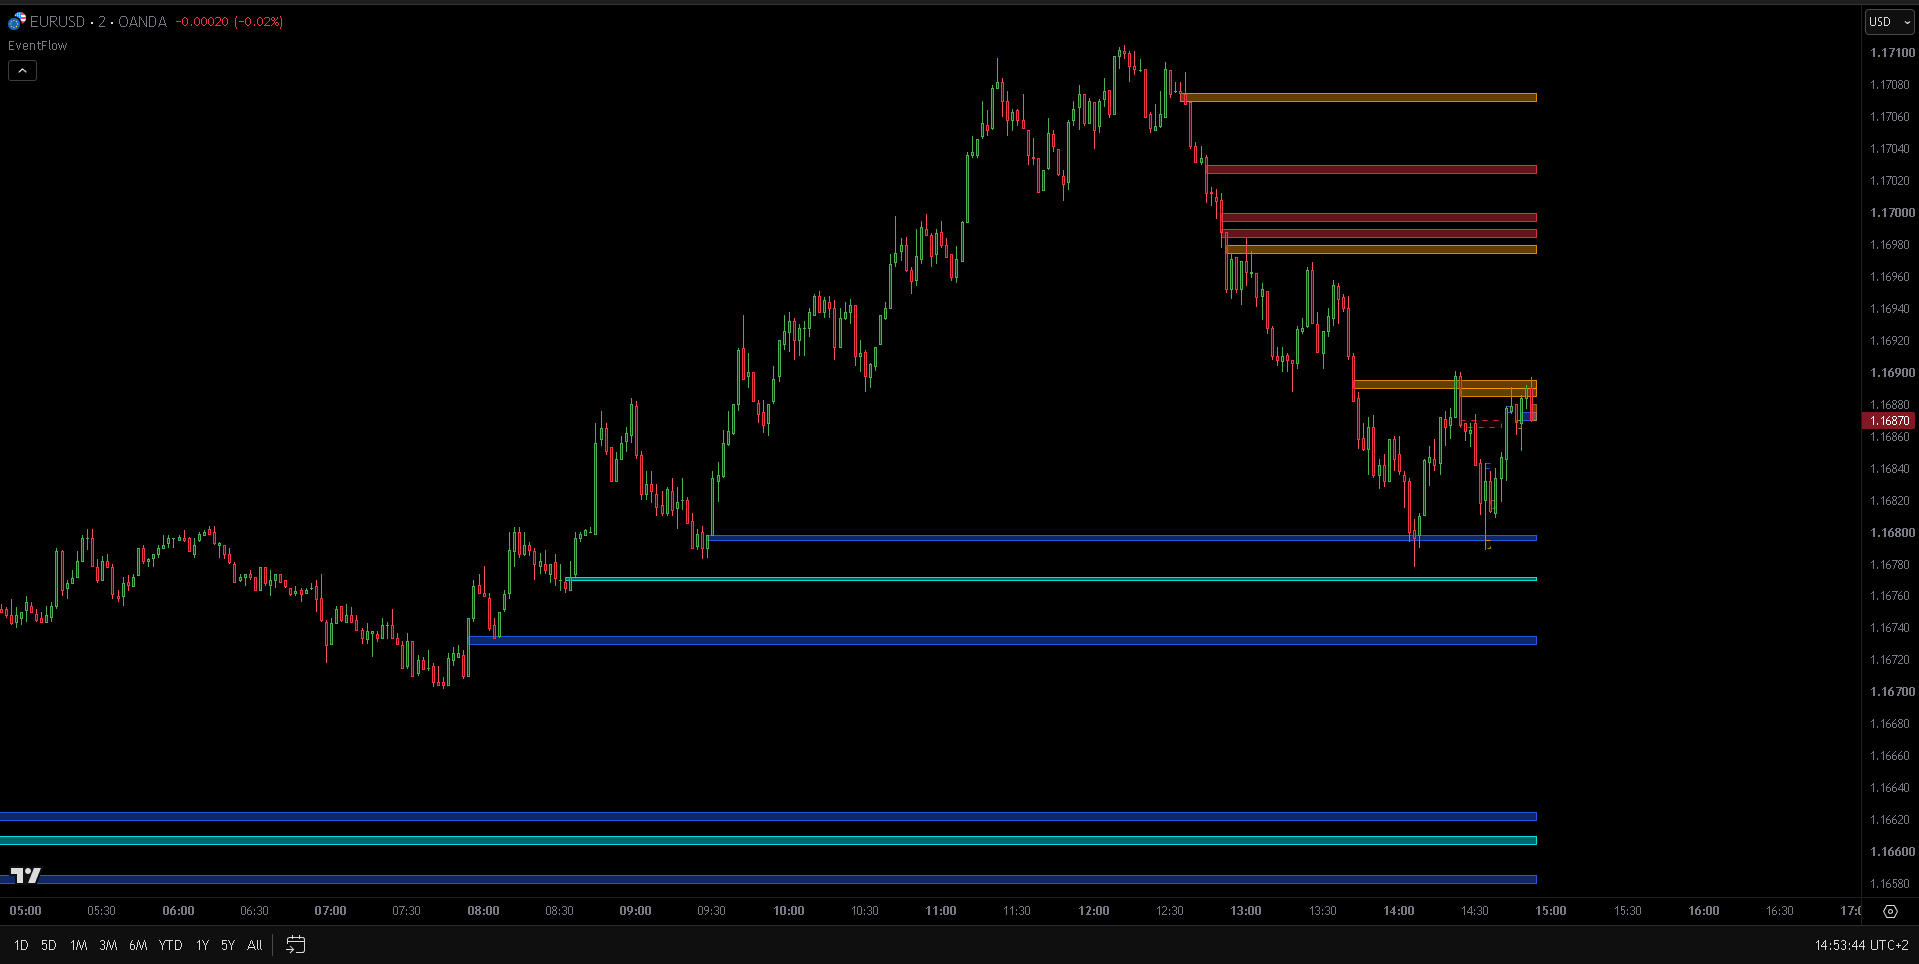
- Successful Initiatives (Zone Development): Occur when aggressive buyer or seller initiative succeeds, causing the price area to consolidate. This establishes stable support or resistance zones capable of triggering clear subsequent price reactions.
- Failed Initiatives (Absorption & Trapped Traders): Occur when an aggressive initiative is immediately countered and overwhelmed by passive liquidity (such as buying pressure being fully absorbed by institutional limit sellers). Instead of fading from the chart, these areas explicitly highlight structural failure, signaling absorption and trapped trader dynamics.
This dynamic framework explains why EventFlow projects zones at key structural points within candle formations (such as extreme highs or lows). It provides a visual representation of buyer vs. seller order flow dynamics, enabling traders to distinguish where an initiative gained control and where it suffered failure.
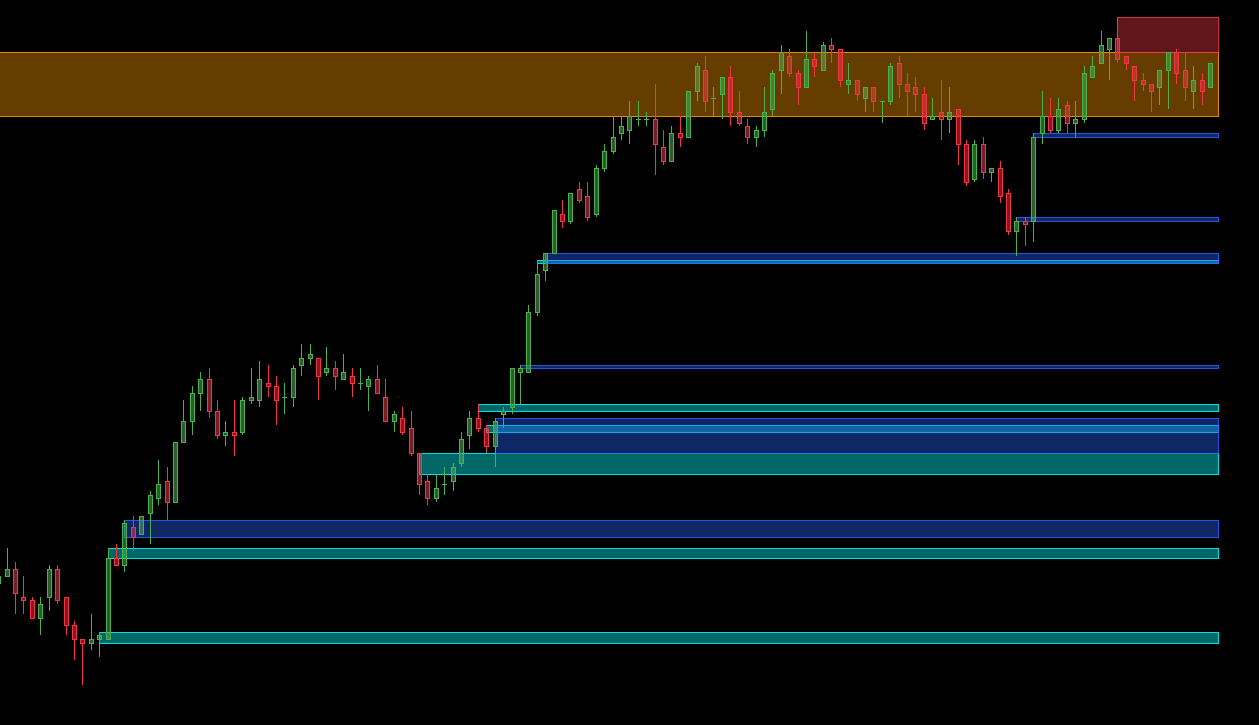
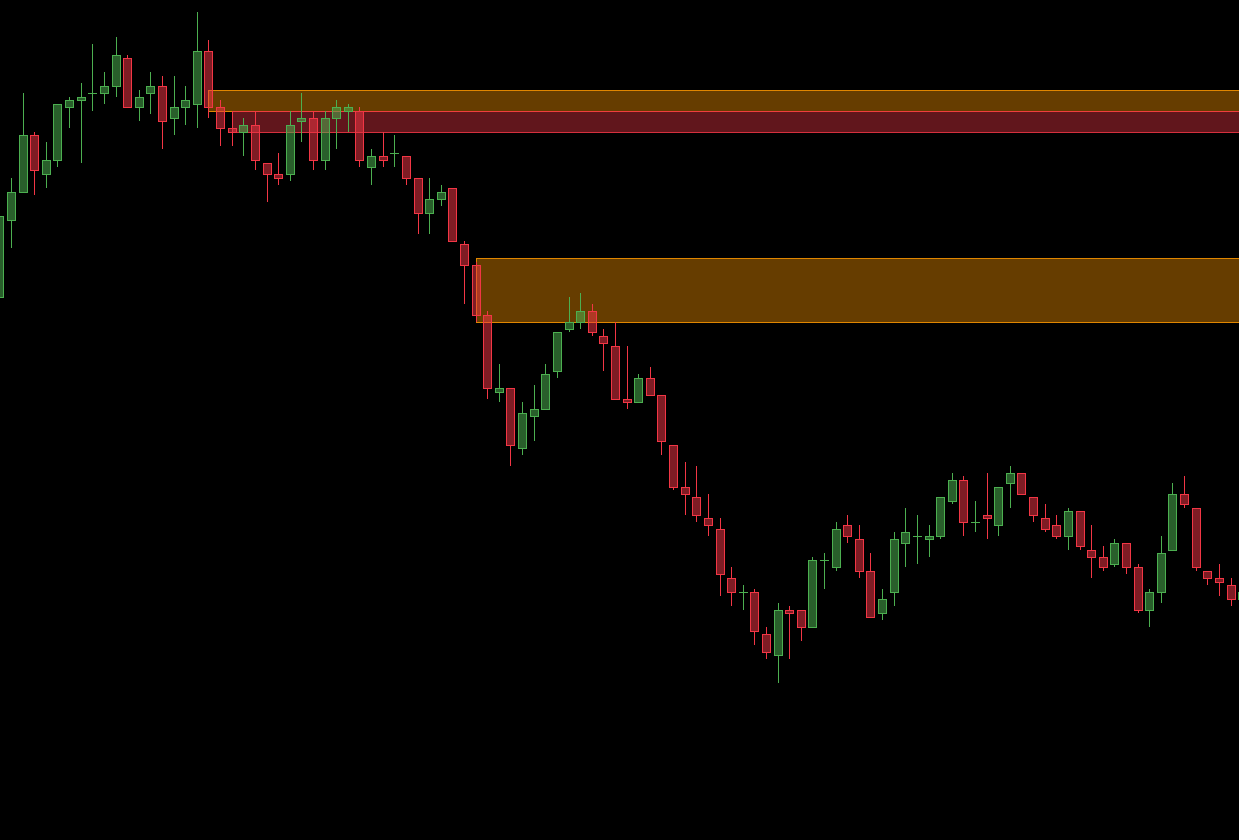
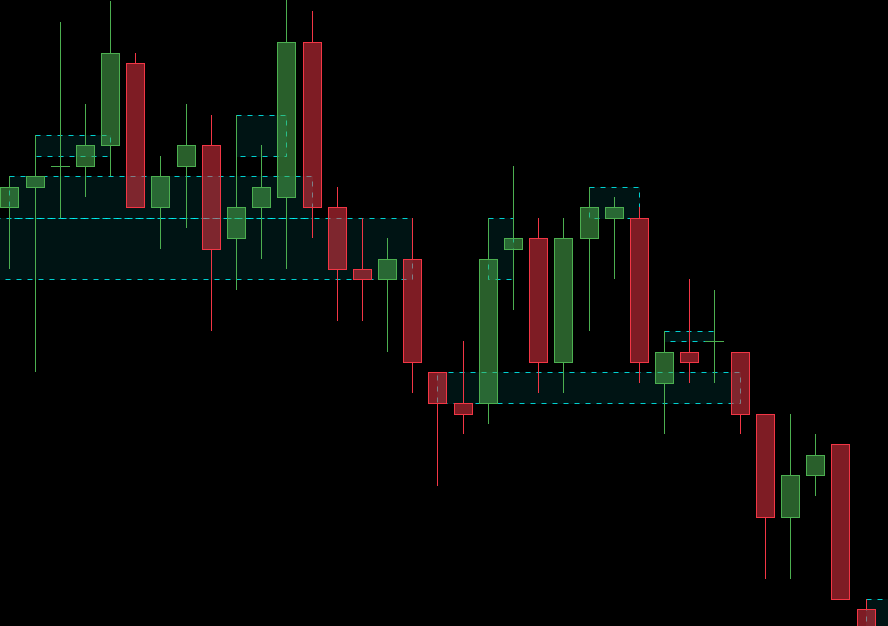
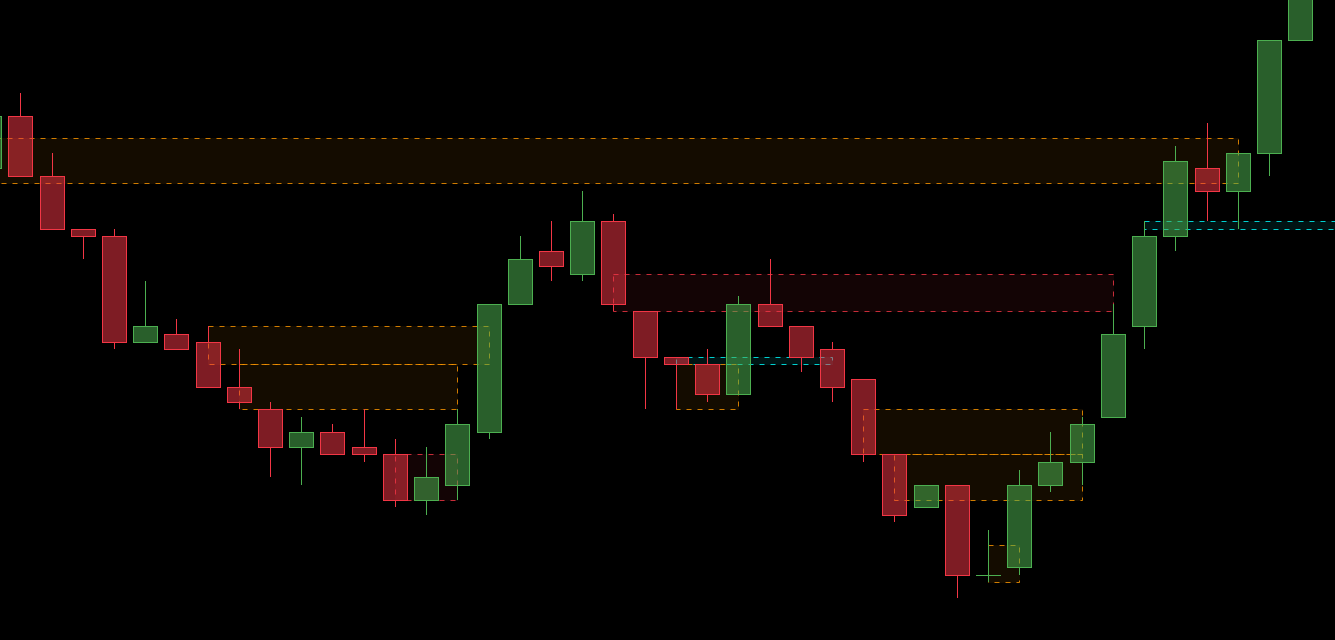
ORDER FLOW SYNERGY: HOW EVENTFLOW MAPS OSCILLATION STRUCTURE WITHIN A RANGE CONSOLIDATION PHASE.
4. VISUAL OPTIMIZATION & NOISE REDUCTION (ANTI-CLUSTERING)
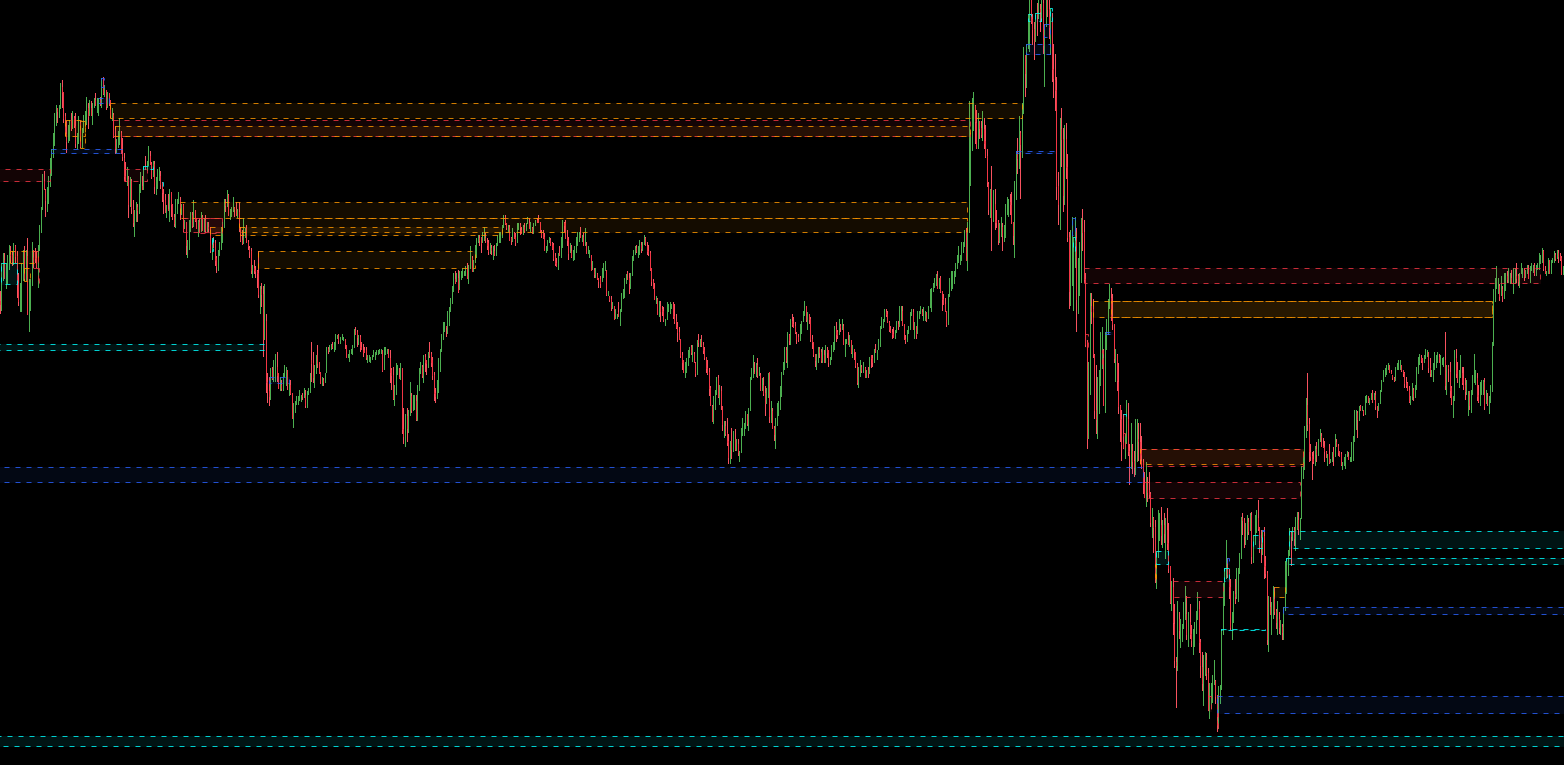
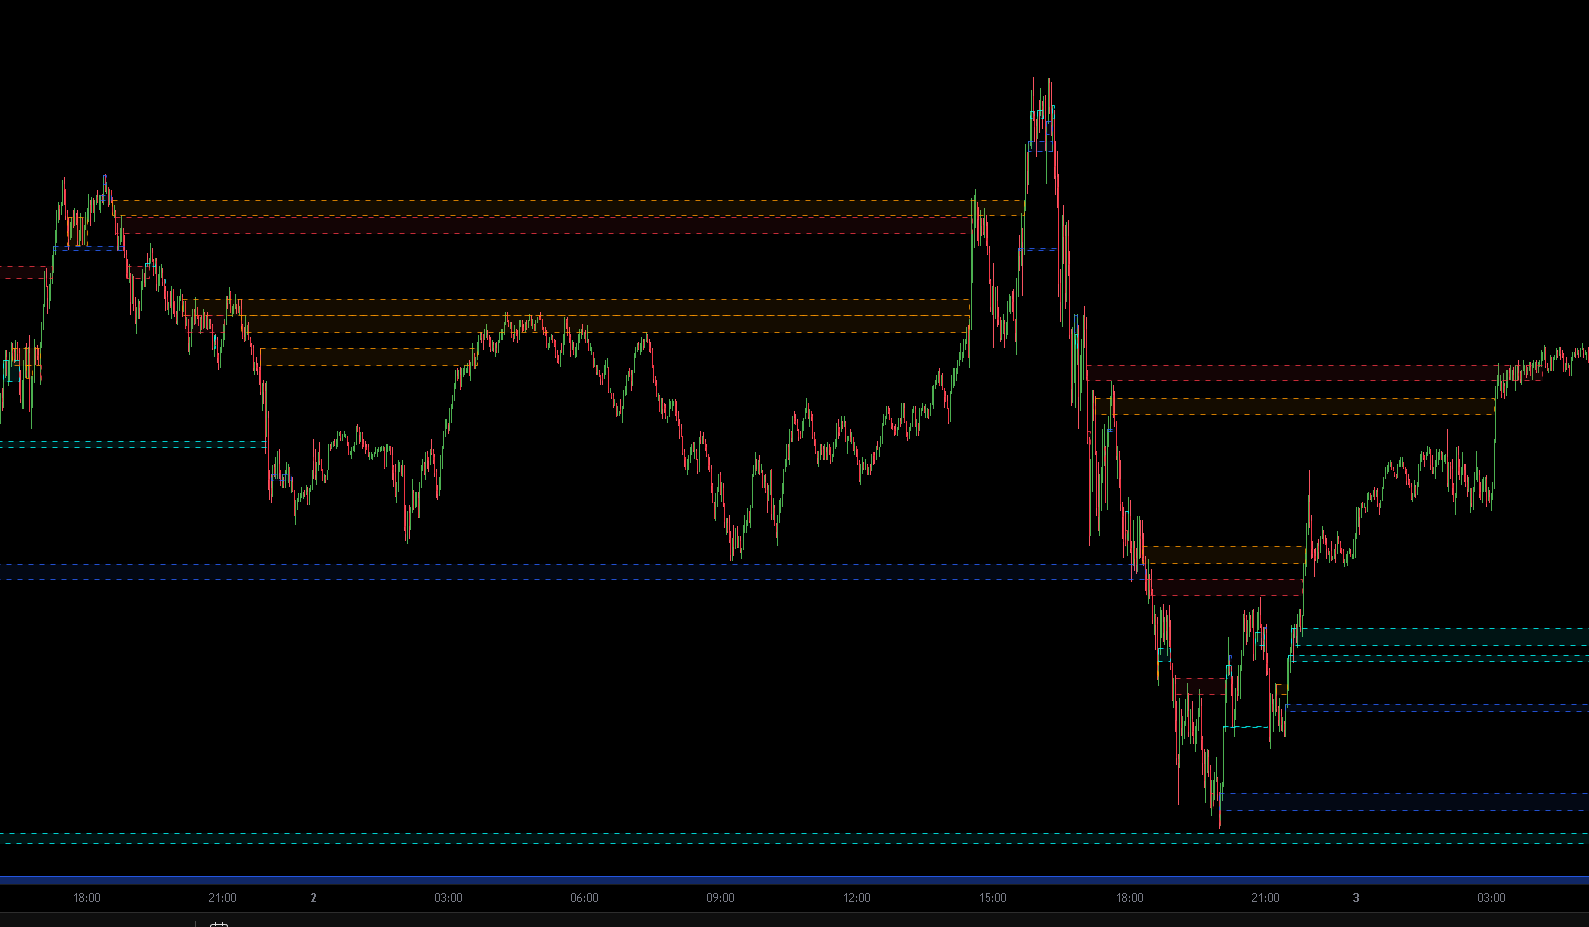
Visual clutter is a primary challenge with order flow indicators. EventFlow incorporates intelligent block-merging algorithms to maintain a clean and effective chart layout at all times:
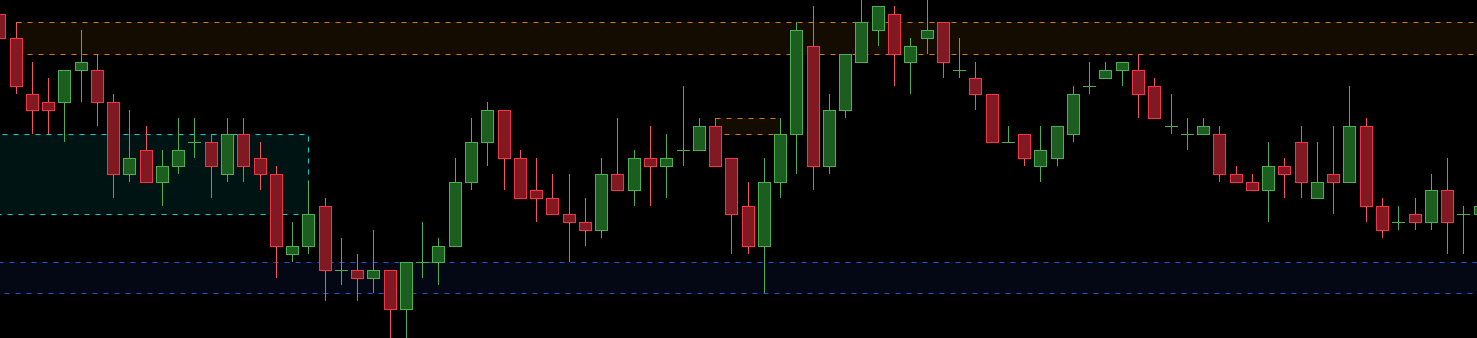
- Zone Merge (Dynamic Consolidation): If two adjacent zones of the same type overlap beyond a user-configurable percentage threshold, the algorithm automatically merges them into a single consolidated zone.
- Mutual Exclusion: Prevents conflicting signals within the same price level. If a support zone develops inside an existing resistance area, the system suppresses its display to prevent visual ambiguity.
5. ZONE LIFECYCLE, TOLERANCE & SESSIONS
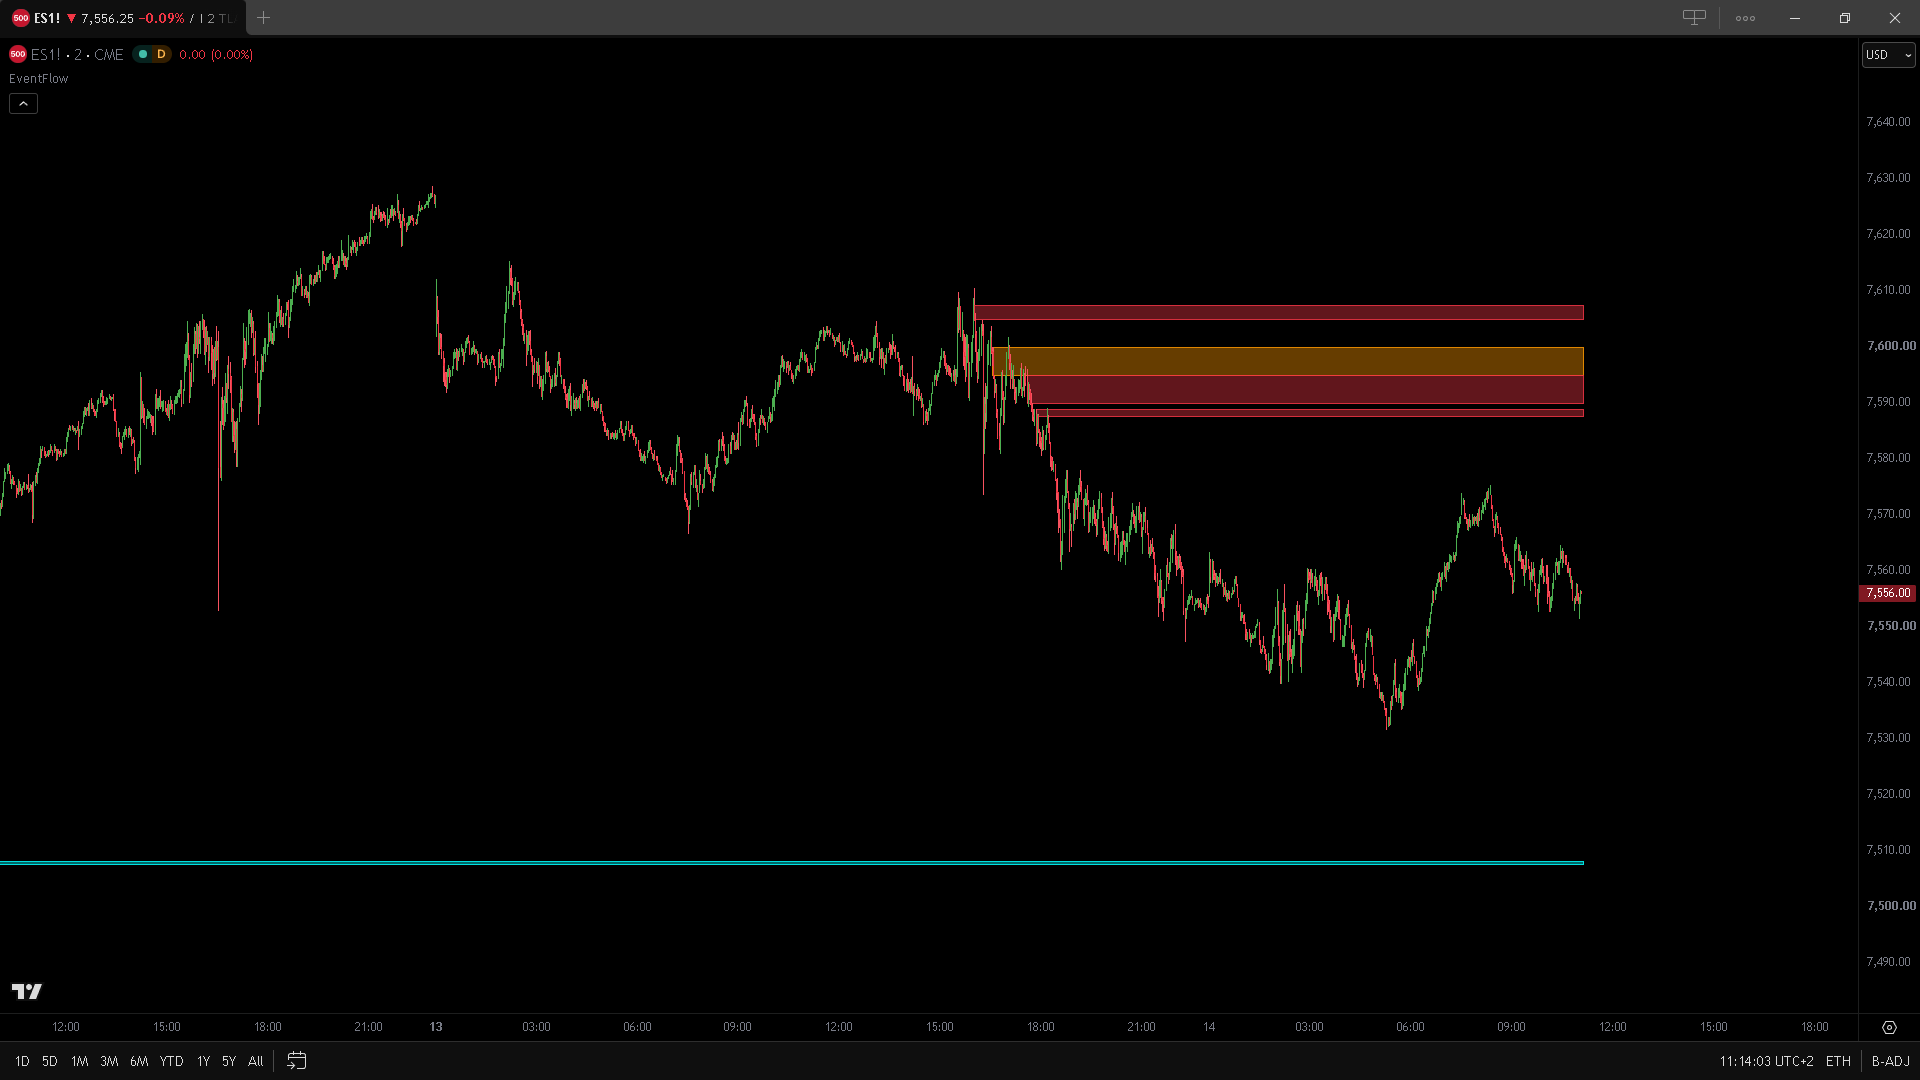
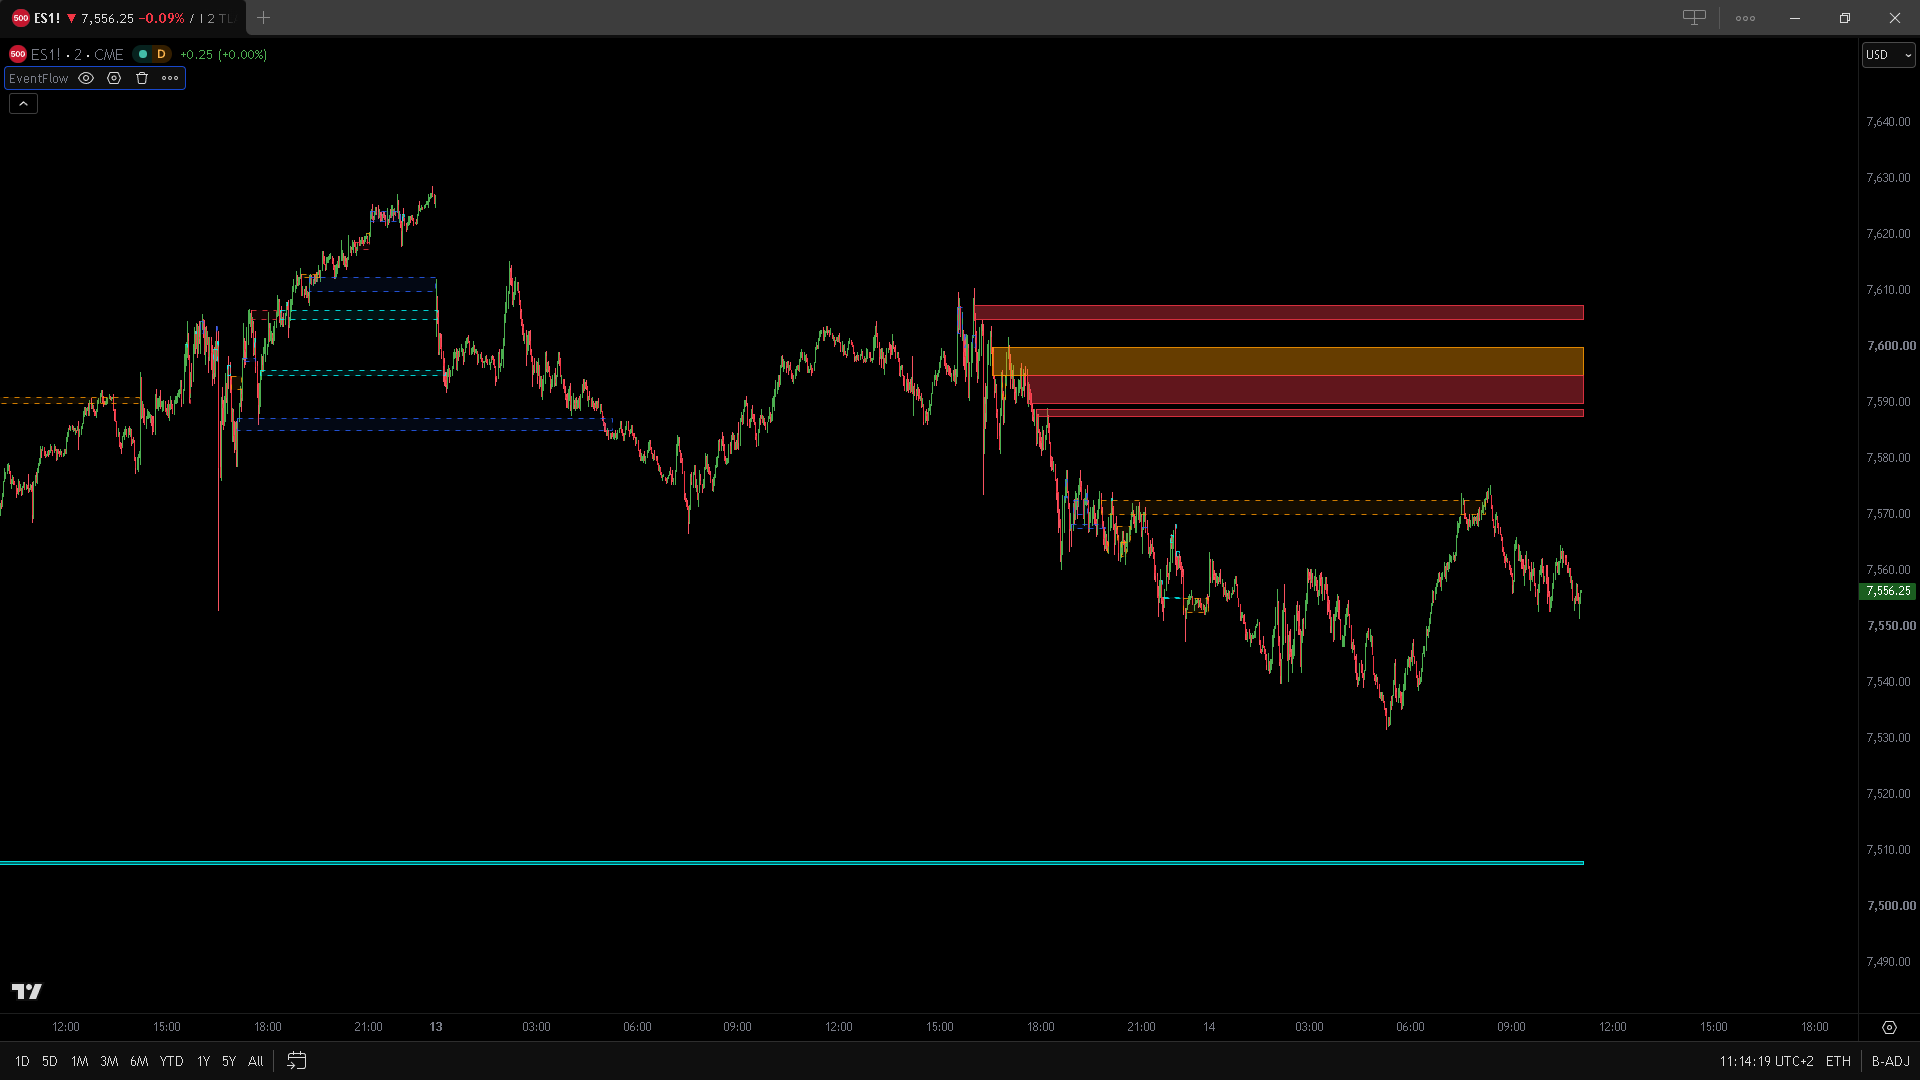
Generated zones interact dynamically with real-time price action, enabling structured and flexible historical tracking:
- Breakout Tolerance (in Ticks): Defines a user-specified tick margin beyond which a level is officially marked as breached by the candle close price, preventing false breakout triggers.
- Broken Zones (Visual Treatment): Once penetrated beyond the tolerance threshold, zones can either be hidden or displayed as low-opacity dashed lines to maintain historical memory for future retest trades.
- RTH Session Filter (Regular Trading Hours): For exchange-traded futures and equities, restricts zone calculation and display strictly to the main session, eliminating overnight session noise.
METHODOLOGICAL USAGE NOTES
Statistical metrics and volumetric anomalies highlighted by XTFlow EventFlow must not be confused with conventional order flow tools or traditional support/resistance levels. EventFlow delivers comprehensive microstructural event analysis across both individual candles and multi-candle sequences, generating insights that reveal market participant intentions across every market phase. This analytical framework provides objective data regarding structural level validity to support execution decisions.
Pairing EventFlow with dedicated Order Flow suites (such as BigEvents and Master V6) maximizes contextual analysis, establishing a comprehensive system for heightened awareness of microstructural dynamics and key entry points.